The Request Logging & Profiling UIs bring an invaluable new level of observability into your App, from being able to quickly inspect and browse incoming requests, to tracing their behavior from their generated events in the Diagnostic Source capabilities added all throughout ServiceStack, which both power the new UIs and enables new introspectability from code where you can now to tap in to inspect & debug when each diagnostic event occurs.
The quickest way to enable access to these new features to your App is with:
npx add-in profiling
Which will add the Modular Startup configuration to your Host project that registers both Request Logging & Profiling features when running your App in DebugMode (i.e. Development):
public class ConfigureProfiling : IHostingStartup
{
    public void Configure(IWebHostBuilder builder) => builder
        .ConfigureServices((context, services) => {
            if (context.HostingEnvironment.IsDevelopment())
            {
                services.AddPlugin(new ProfilingFeature
                {
                    IncludeStackTrace = true,
                });
            }
        });
}
Whilst Request Logs can be added with:
npx add-in requestlogs
Or if you prefer to store Request Logs in an SQLite database:
npx add-in sqlitelogs
Or to store Request Logs in PostgreSQL, SQL Server or MySql:
npx add-in db-requestlogs
The default configuration looks at providing useful information during development, where the response request bodies are captured in the Request Logger and the StackTrace is captured on the important events where they can be useful.
Configuration
Depending on your App you'll want to change these defaults, e.g. if you're persisting the request logs using the CSV Request Logger or Redis Request Logger it may not be feasible to capture all API responses if they're very large.
If enabled, StackTraces are captured in these important events:
- ServiceStack: Before a Service Gateway Request is sent
- OrmLite: Opening a connection or rolling back a transaction
- Redis: Opening a connection, auto retrying a failed command, renting & returning clients from a redis manager pool
The latter of which is useful when resolving concurrent usage issues.
As it adds overhead, profiling should only be added when used, e.g. during development or when needing to debug production issues. Although you may always want to capture request logs depending on how important it is to maintain an audit of completed API requests. Should it be needed, both Logging & Profiling plugins offer several configuration options to control the type, info & events captured.
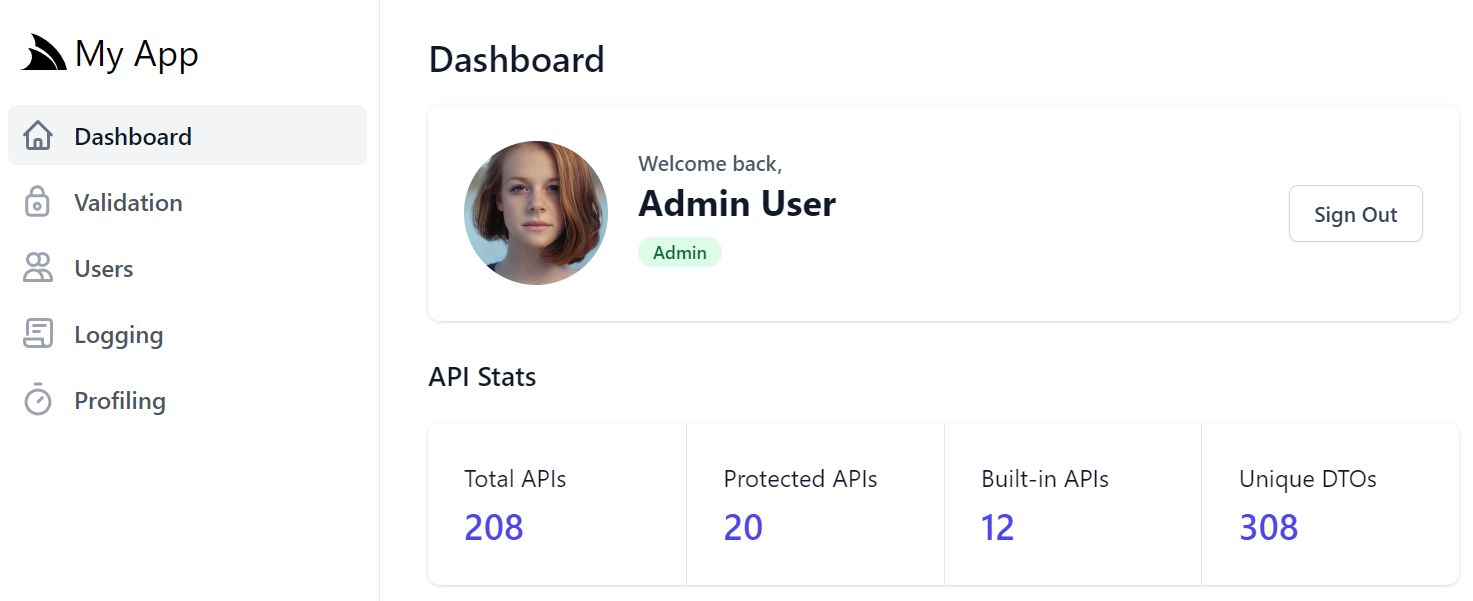
Whichever features you have registered will dynamically appear in the Admin UI's sidebar for quick navigation:
Request Logging UI
Clicking on Logging navigates to the Request Logging UI which displays each API request processed in a grid of useful summary information showing high-level information for each HTTP API request:
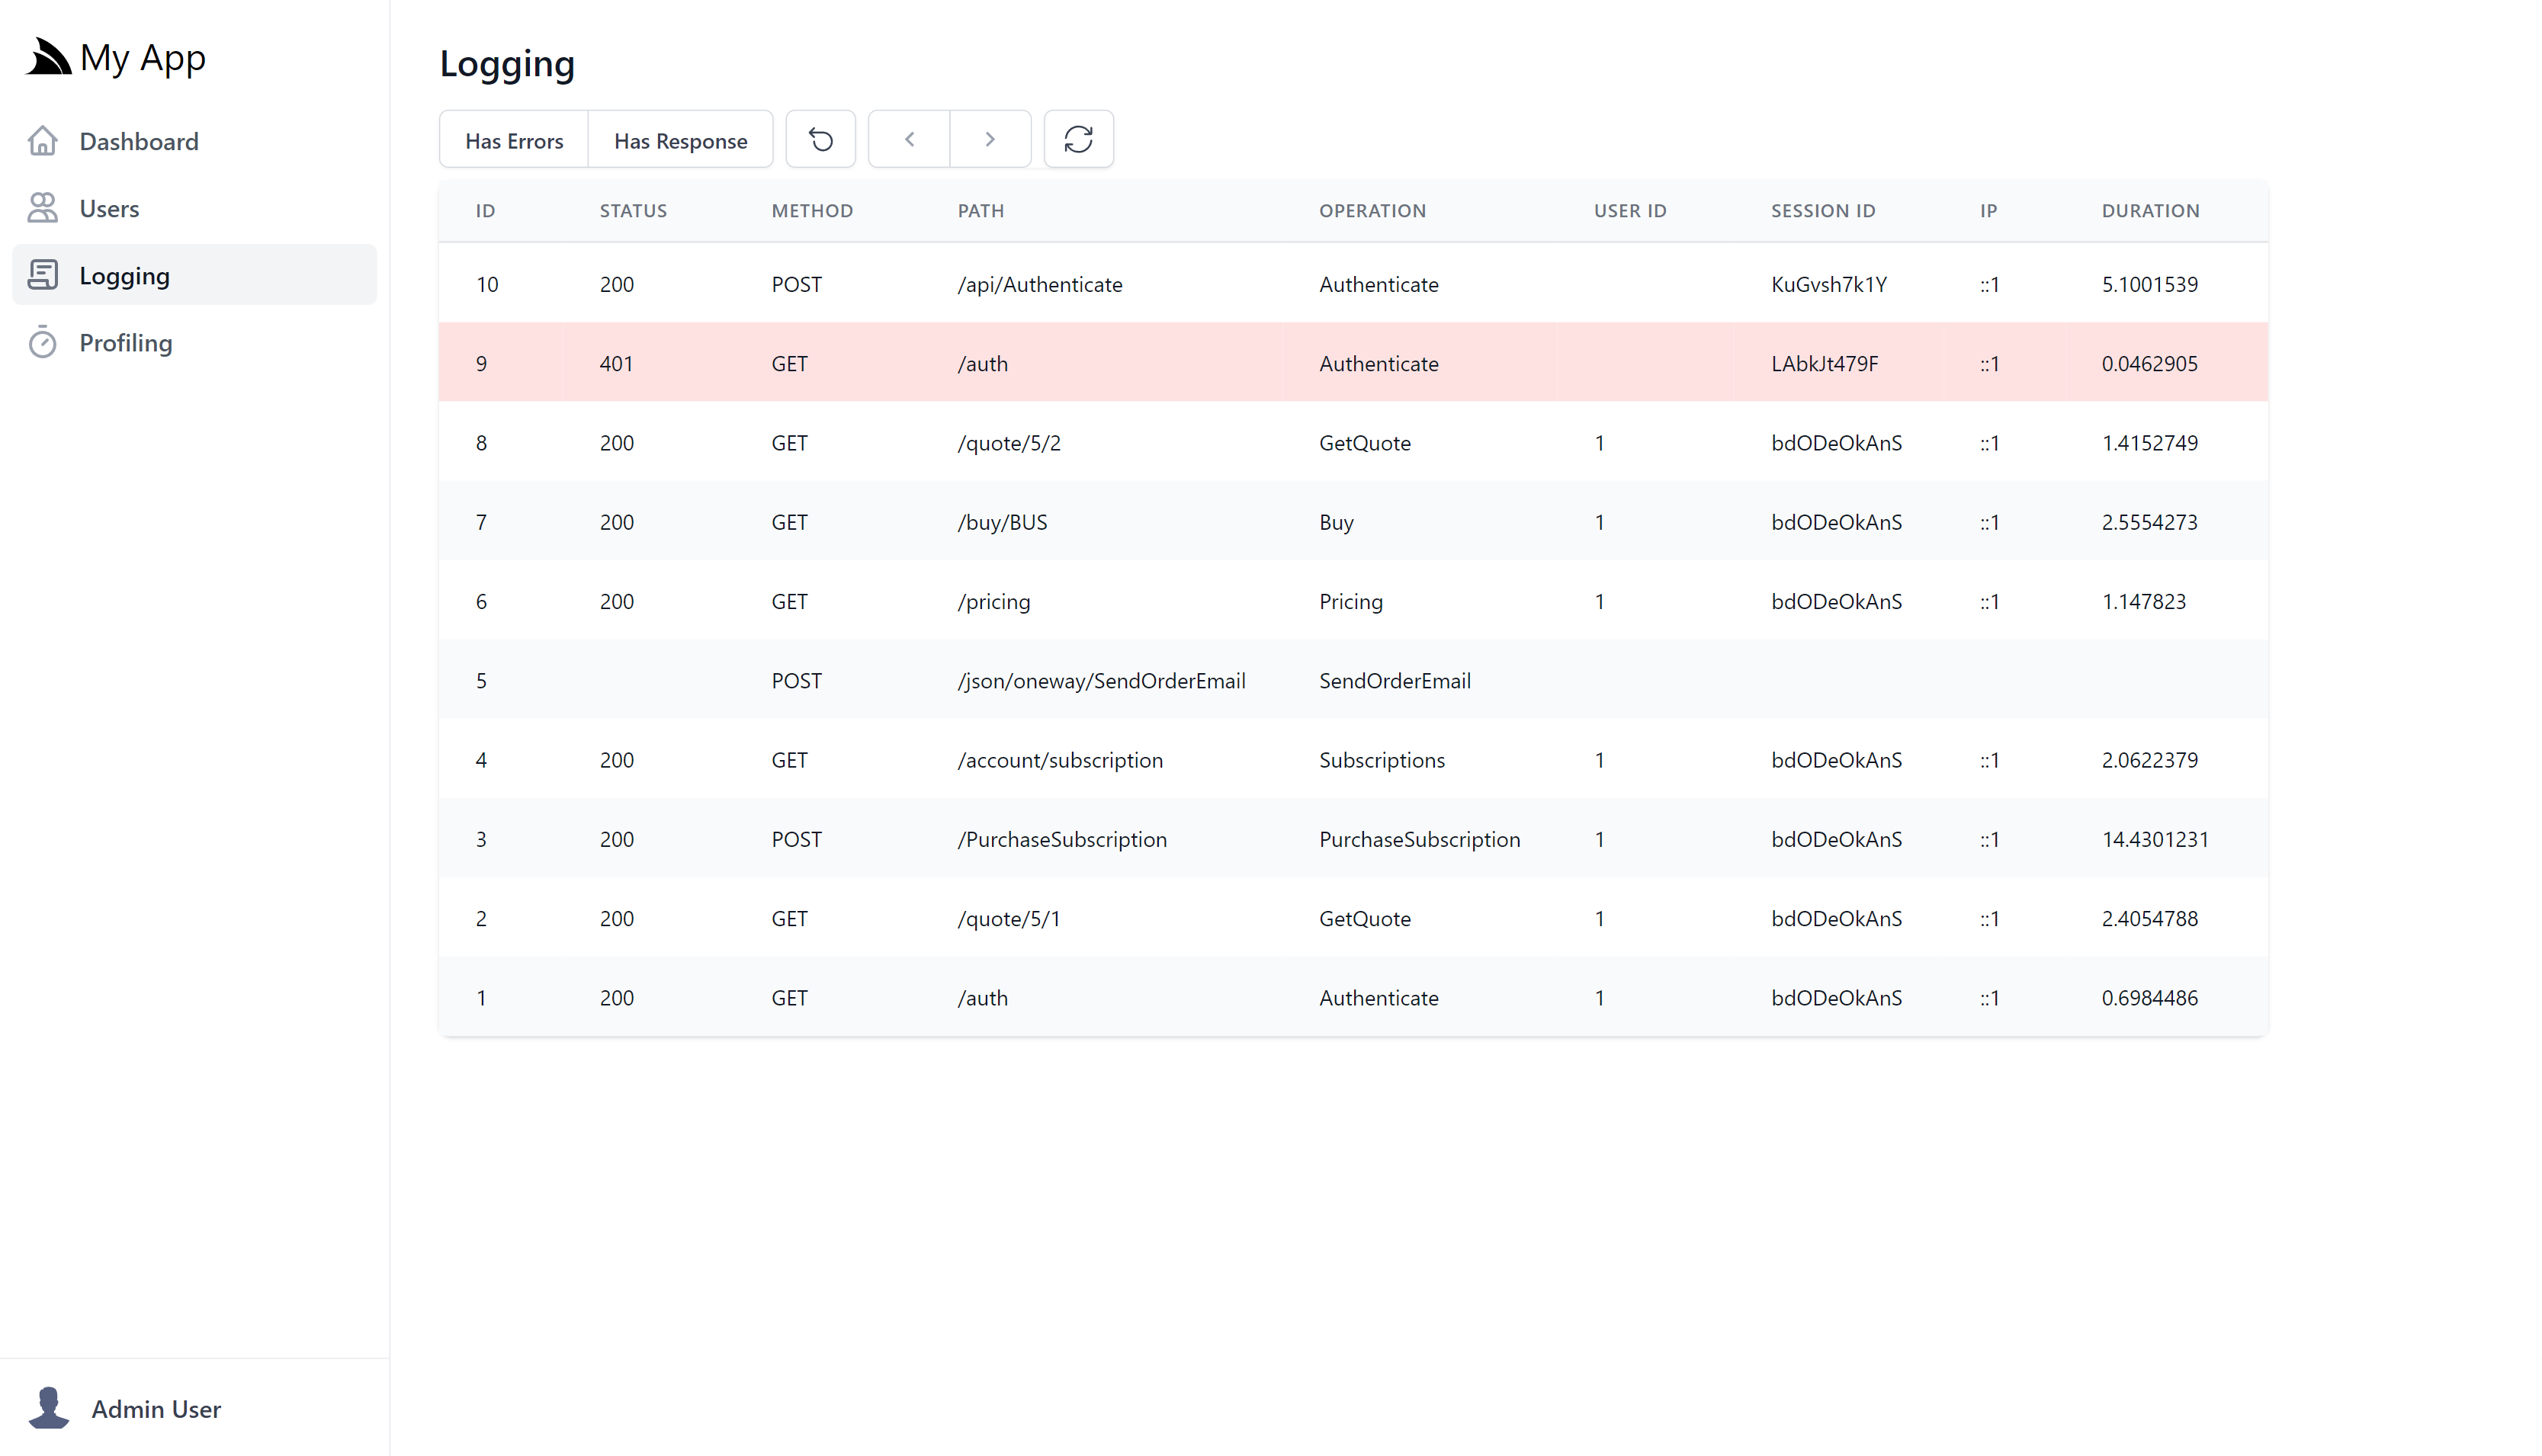
This screenshot shows an example of a non-authenticated user navigating to a protected page before signing in then querying and submitting a new Booking in the AutoQuery CRUD Bookings Demo using Locode's Auto UI, in which we can see error API Responses are highlighted in red and redirects highlighted in yellow.
The top navigation controls which results are displayed with:
- Has Errors - Show only requests with errors
- Has Response - Show only requests with response bodies
- Reset Filters Icon - Clear all filters (ESC)
- Left/Right Icons - Navigate to previous/next pages (LEFT/RIGHT)
- Refresh Icon - Reload the latest results
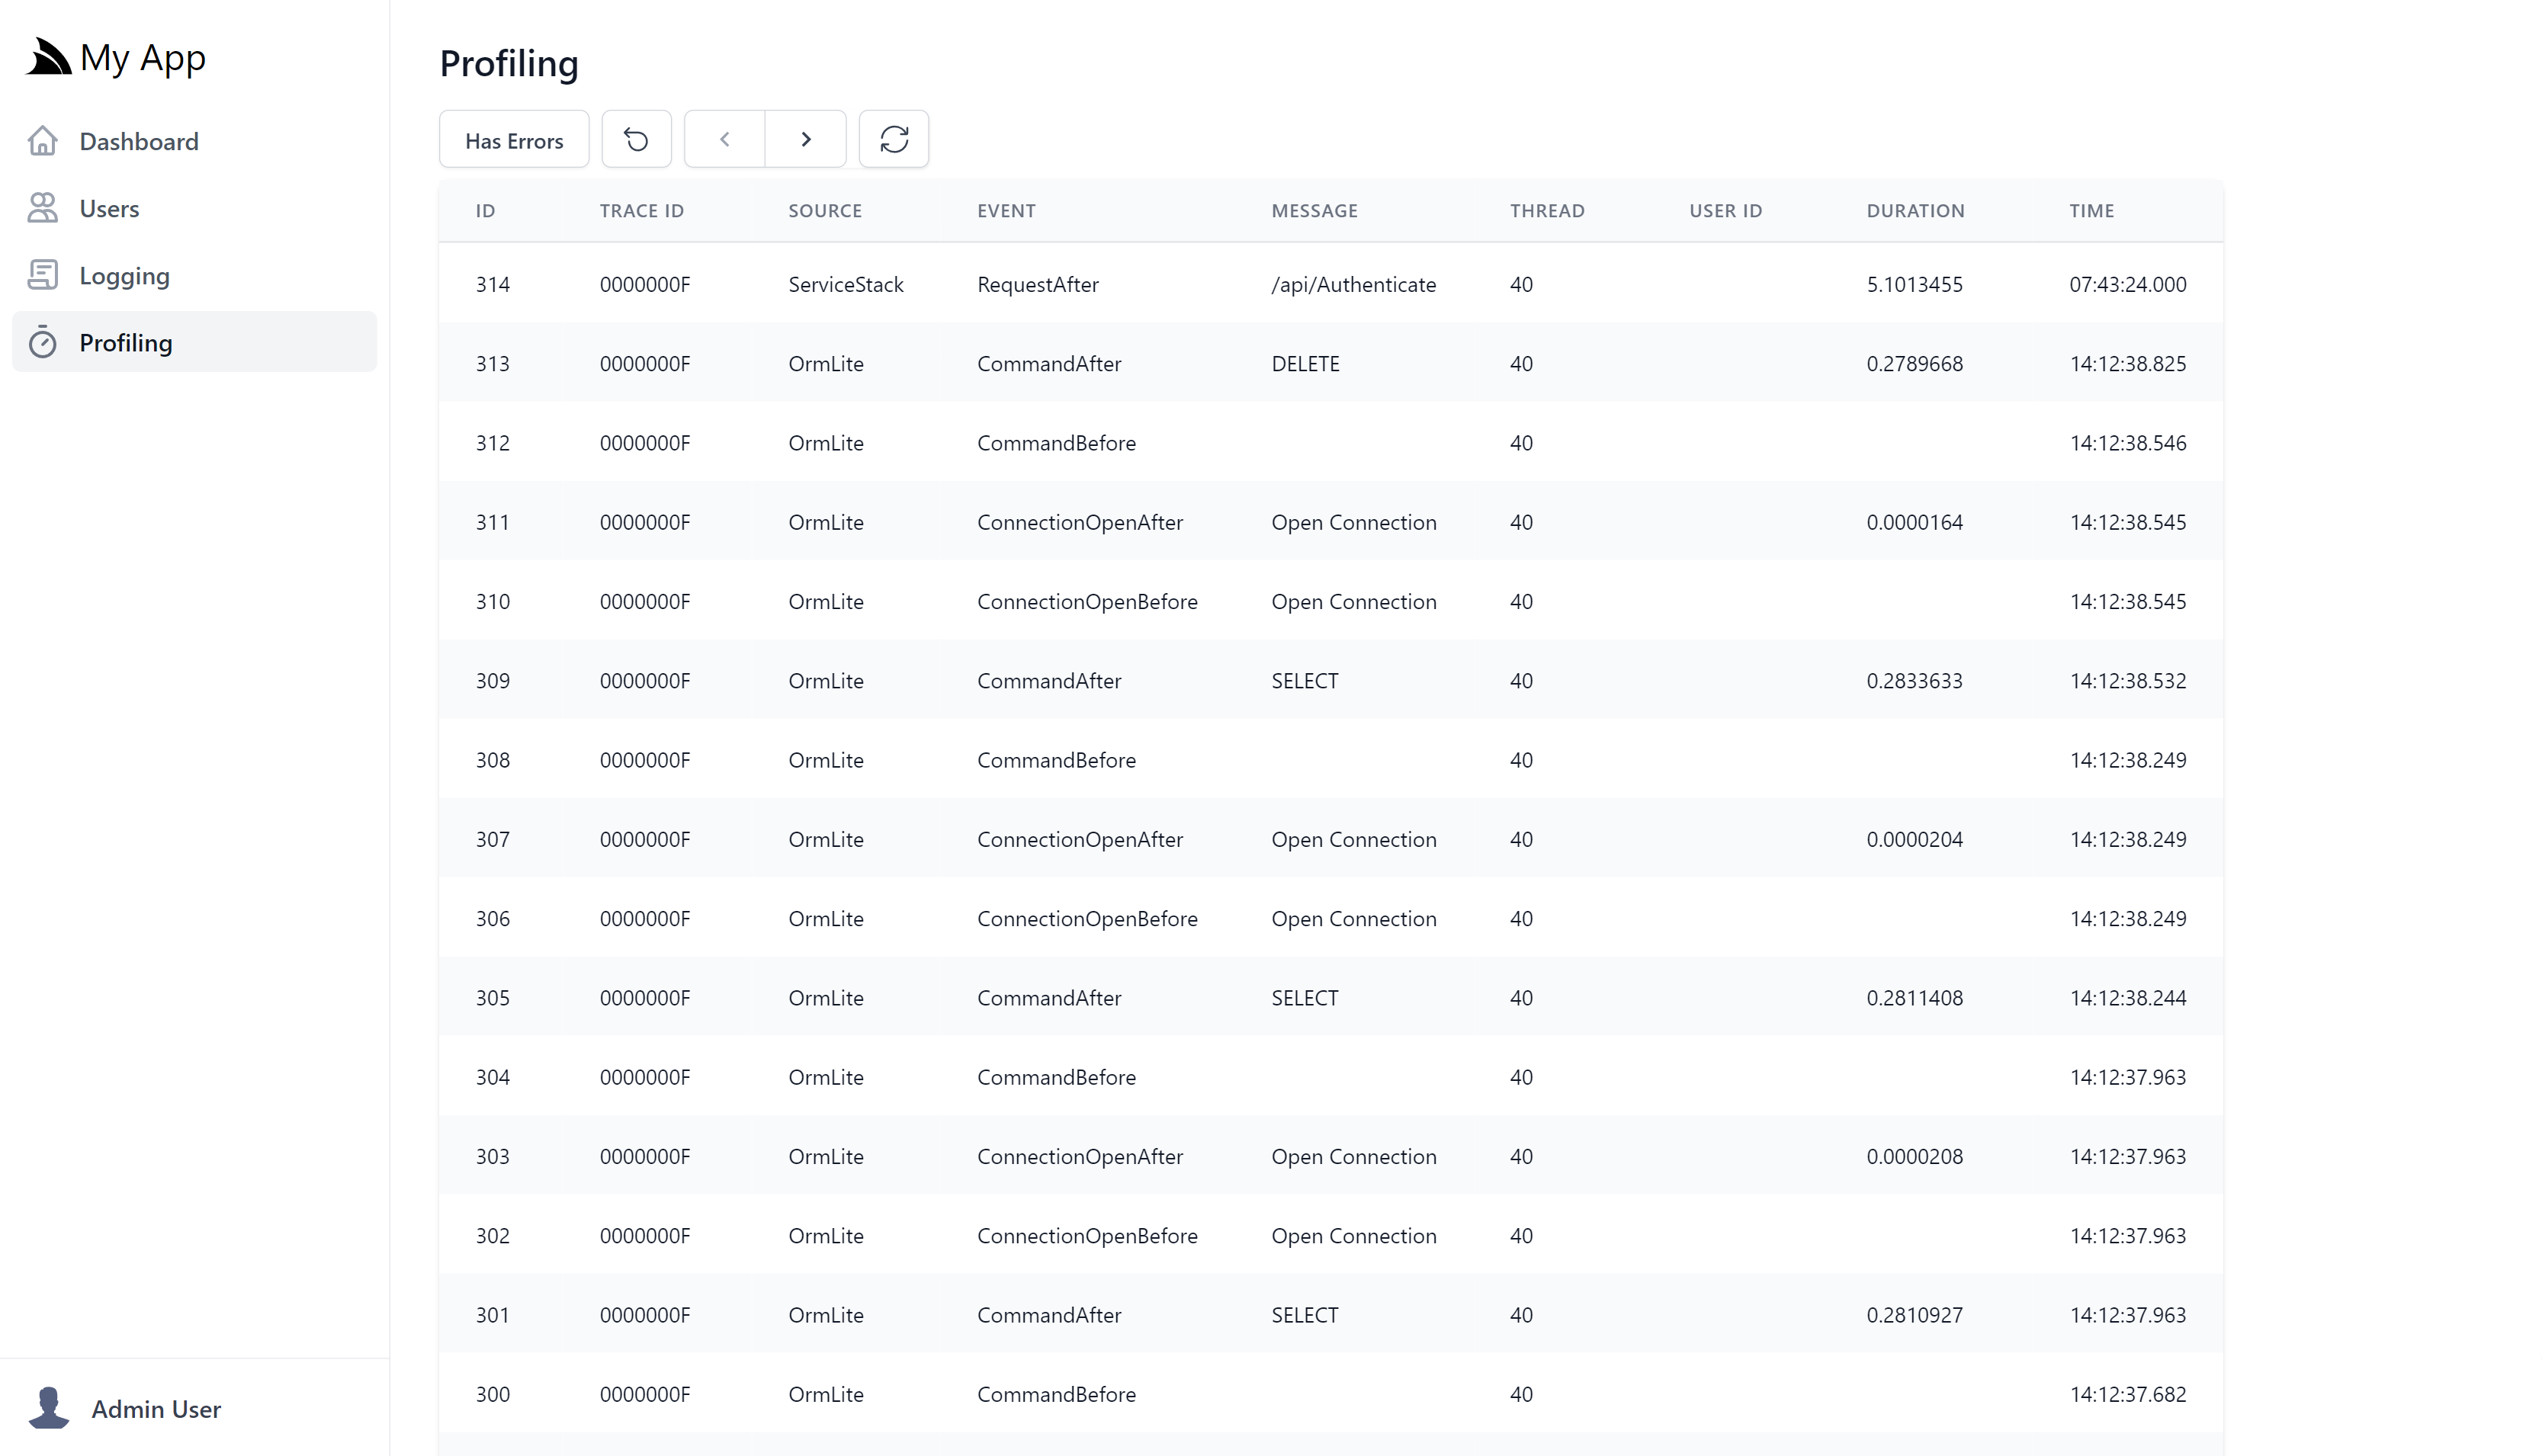
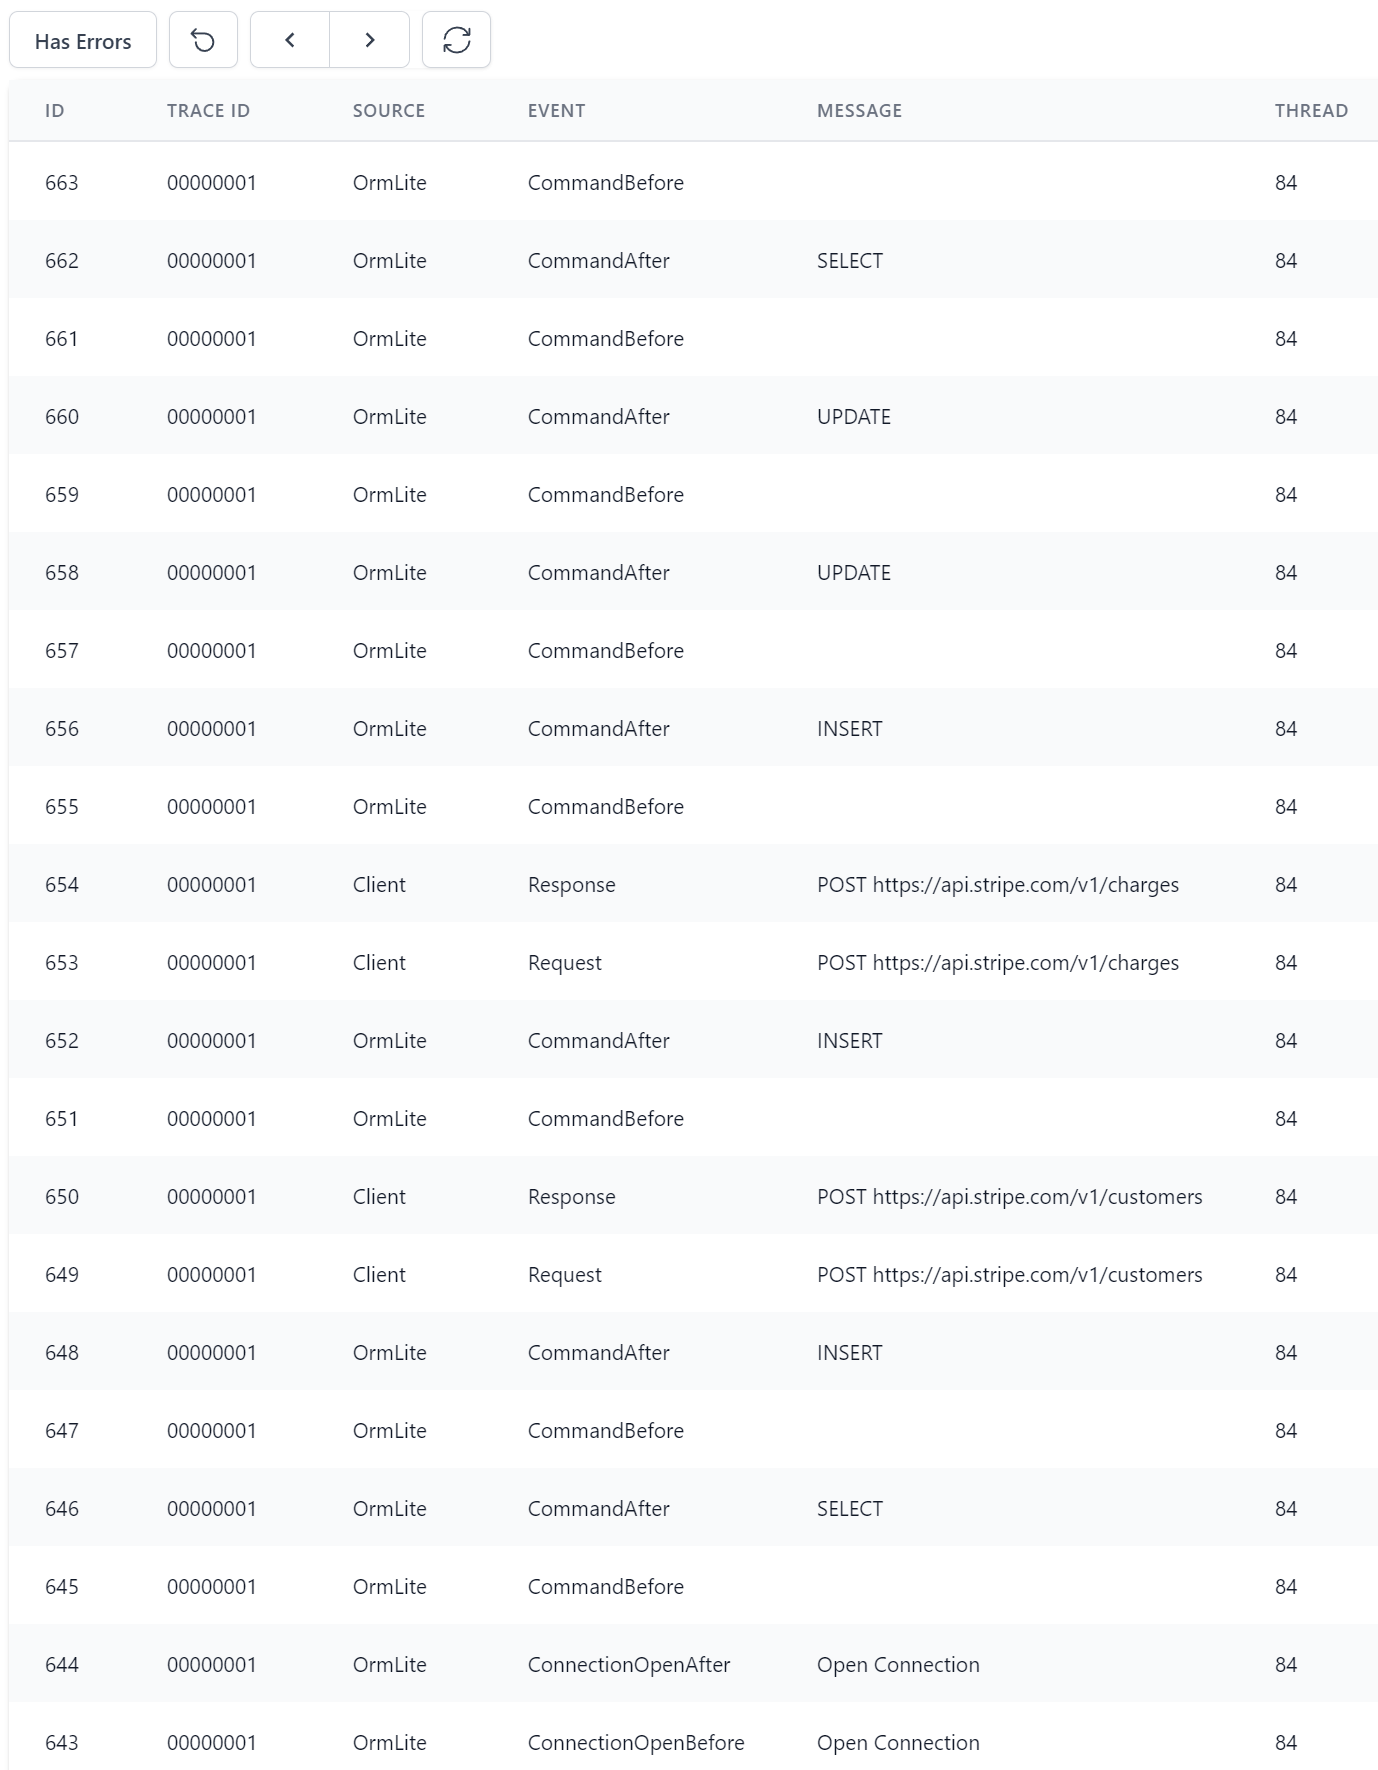
This same user workflow is also captured in the Profiling UI in much finer granularity, capturing all the events performed by APIs:
Clicking on an entry previews it in more detail, e.g. clicking on the first /api/QueryBookings will show the API Request and Response made:
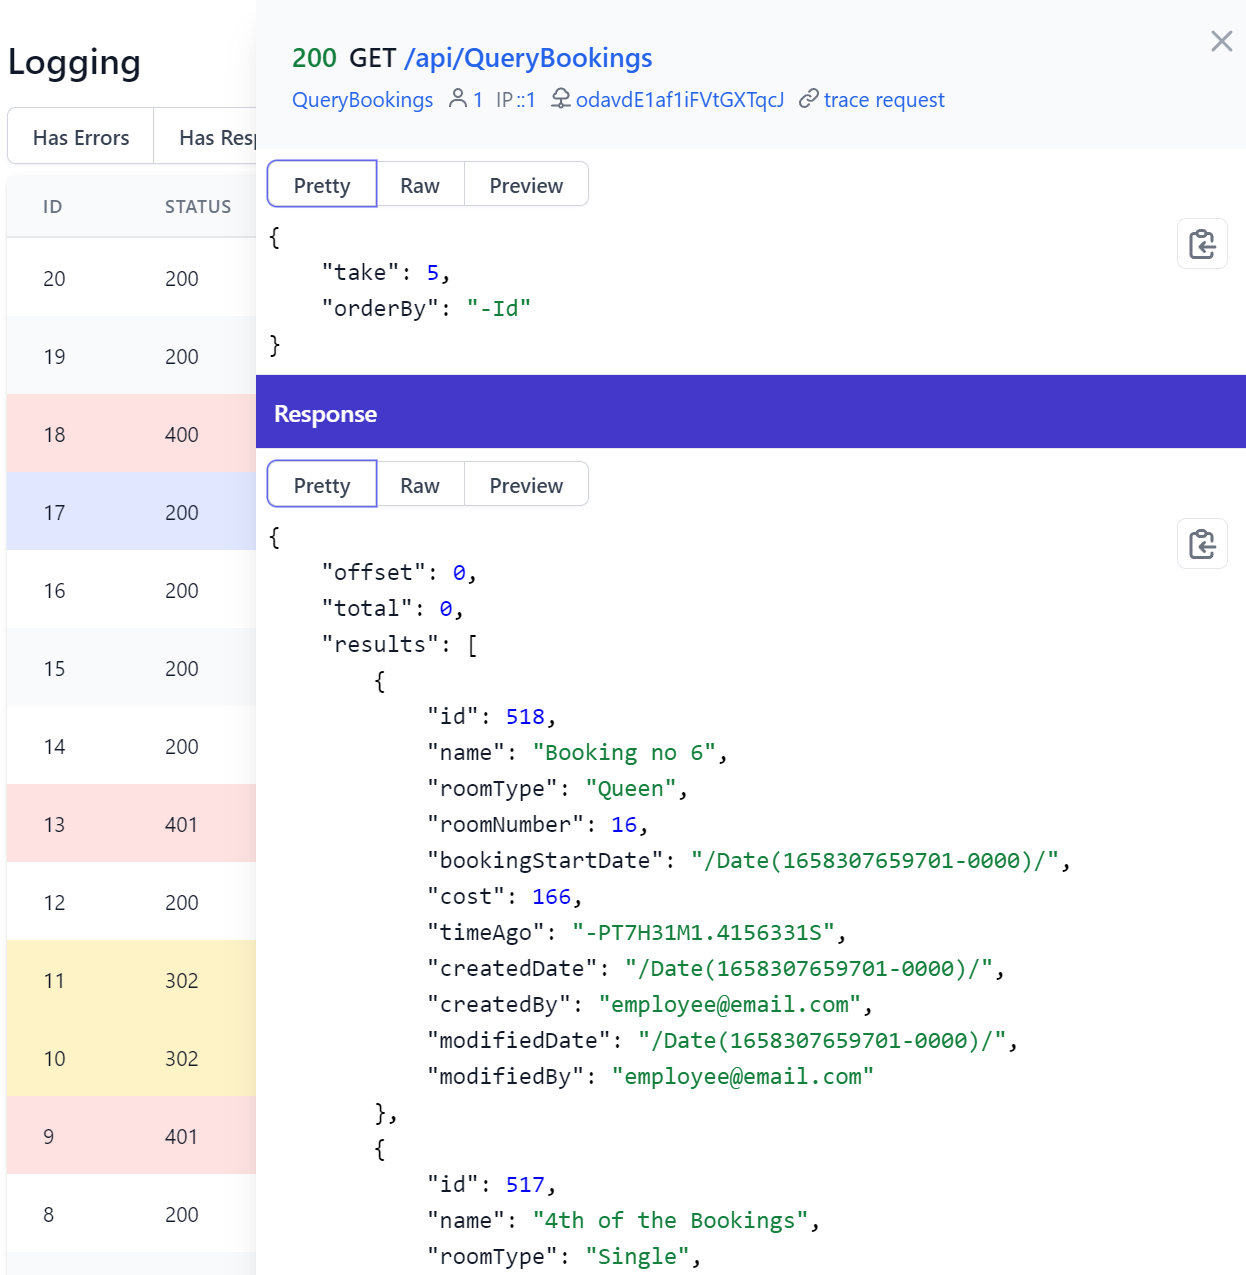
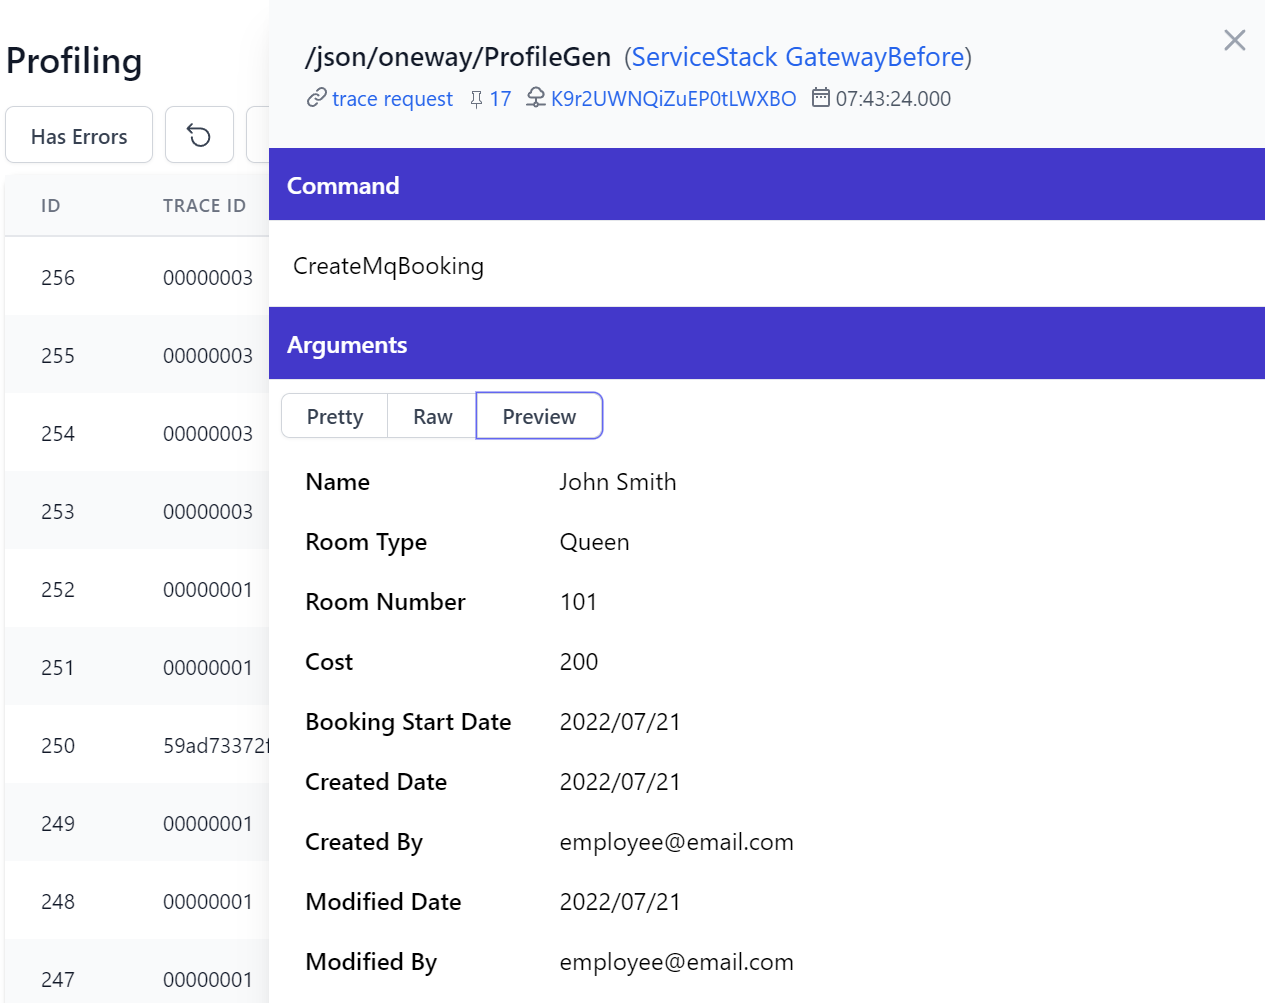
By default it shows the Request and Response DTOs in JSON, but clicking on preview often shows a more human-friendly view:
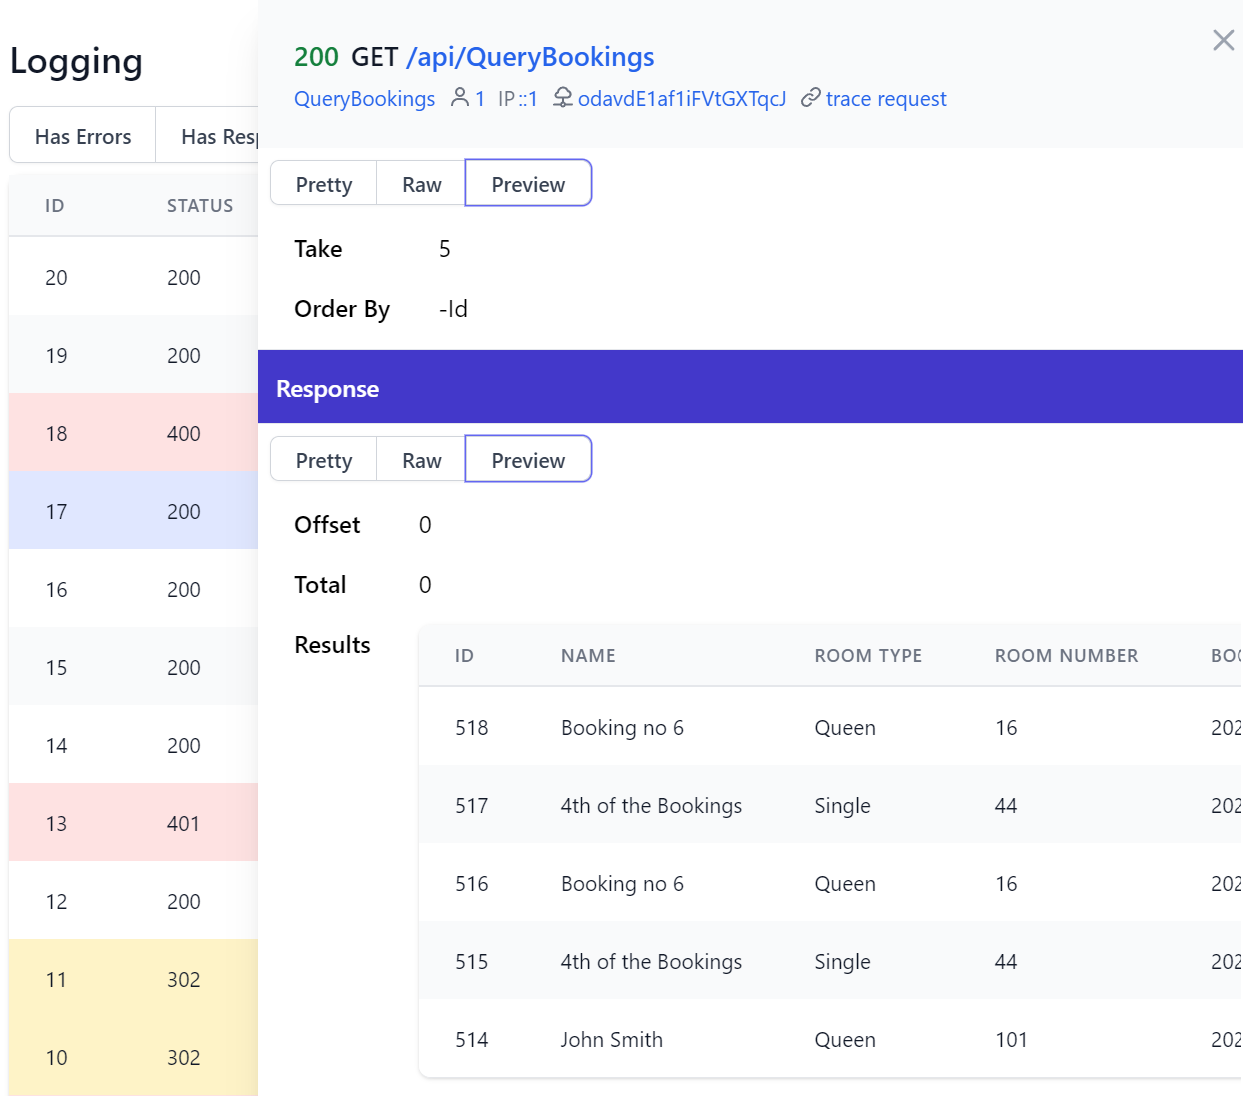
A useful feature from having a dedicated UX-friendly UI is enabling quick navigation where each blue link will display results filtered to all matching requests, whilst the trace request link will navigate to the Profiling UI showing all diagnostic events performed within that request.
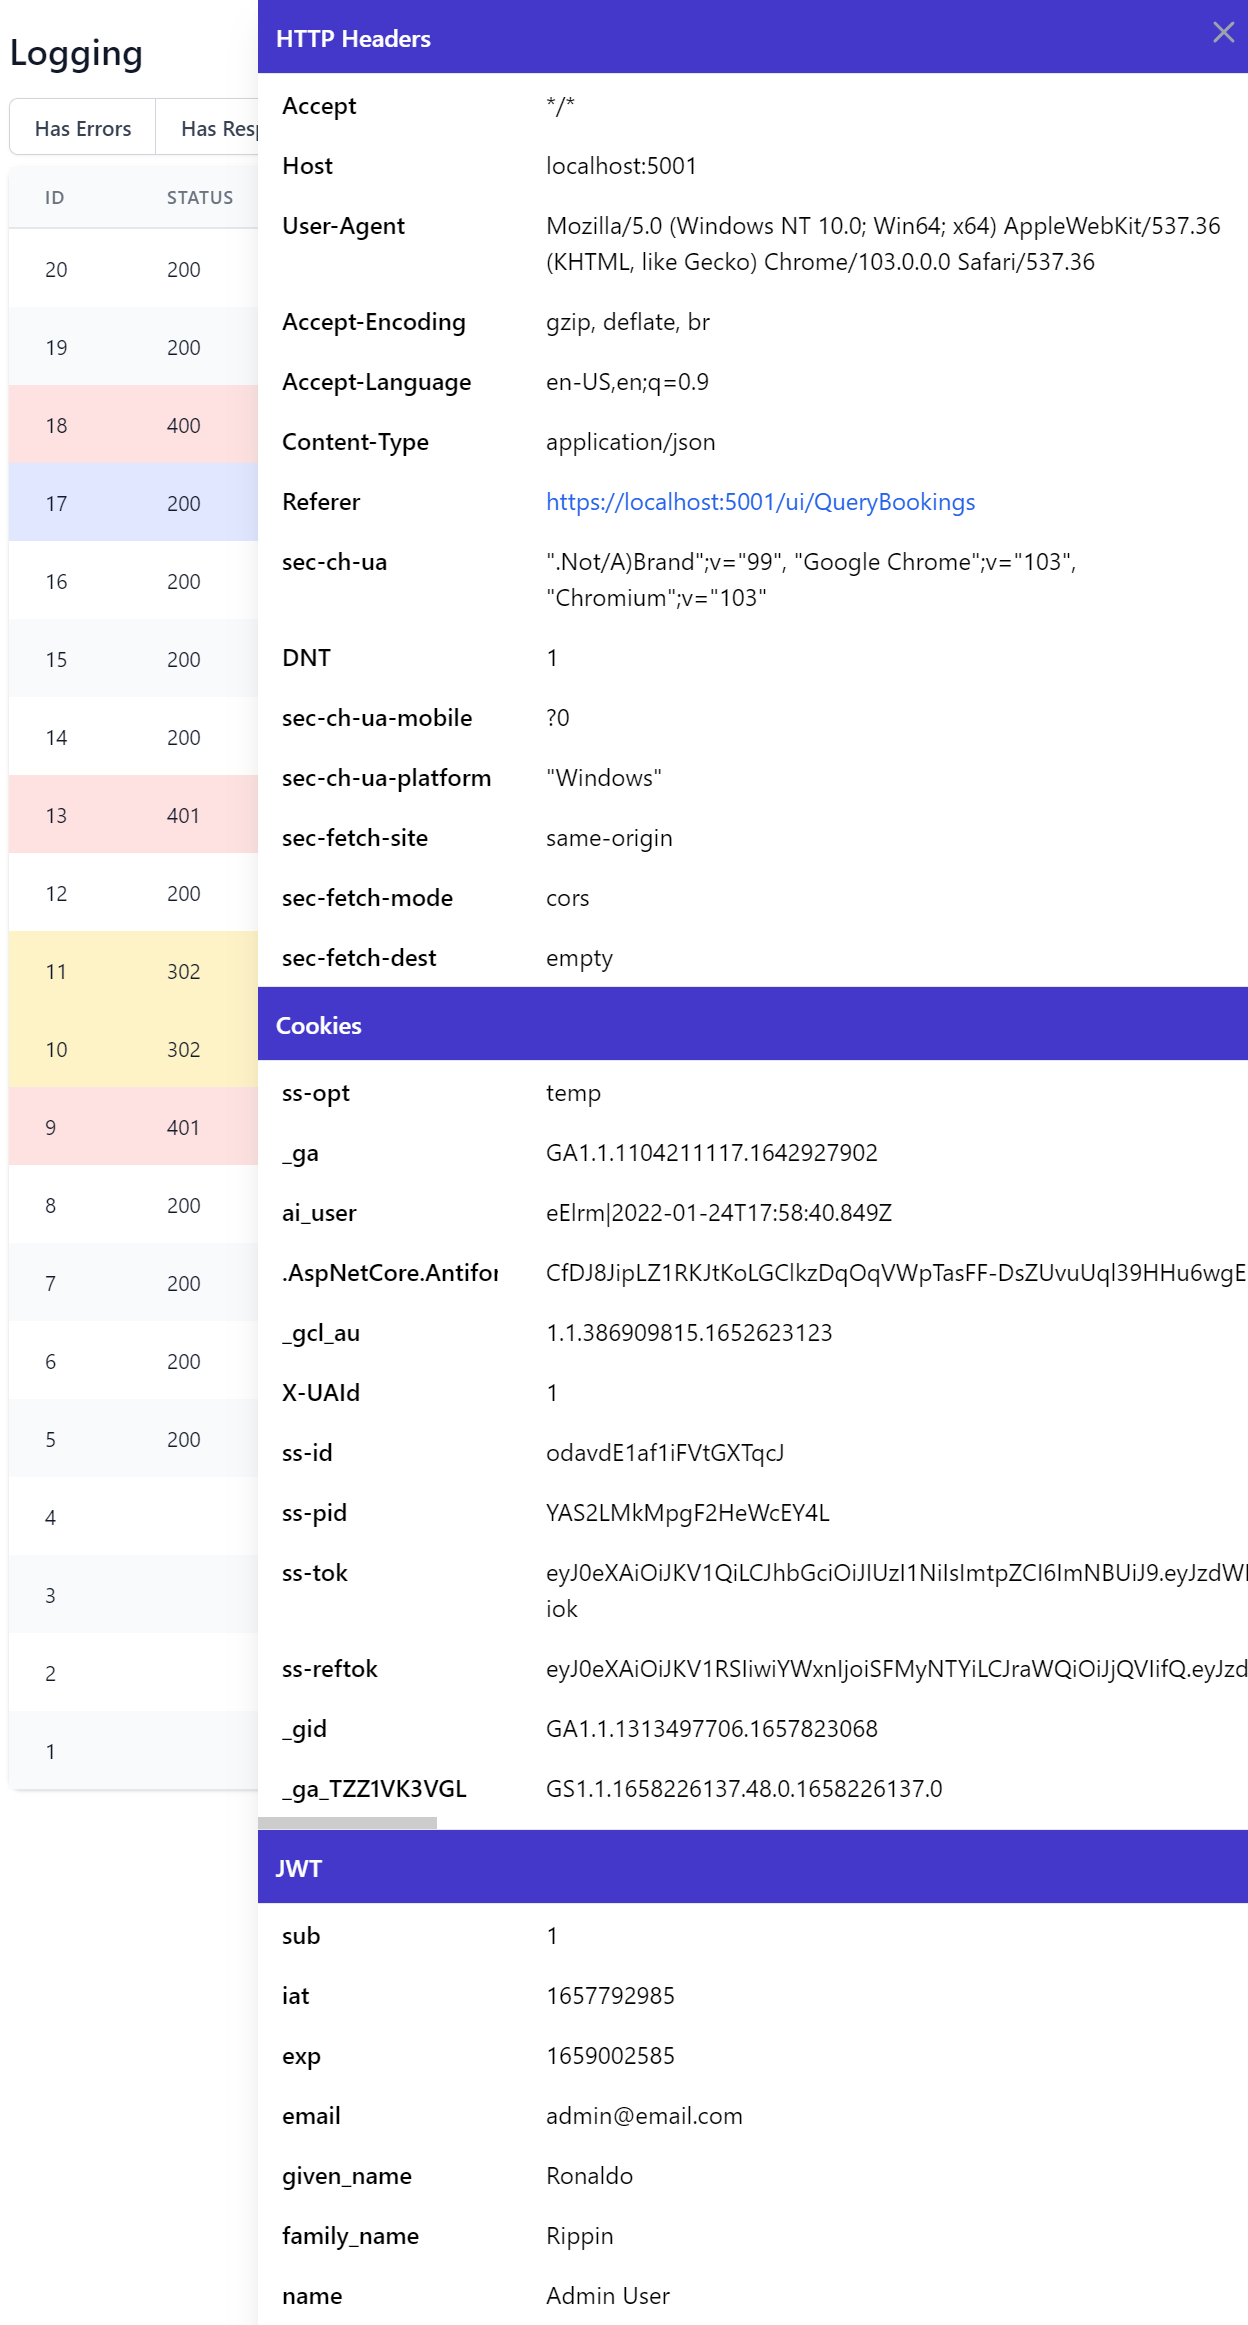
Inspect Cookies and JWT Tokens
In addition to Request & Response DTOs, the Logging UI also shows all captured HTTP information including HTTP Request Headers with any Cookies being extracted into its own view for better readability as well as decoded JWT payload from the ss-tok cookie when using JWT Auth with non-encrypted JWT defaults.
Lets now take a look at the failed CreateBooking request to see what went wrong:
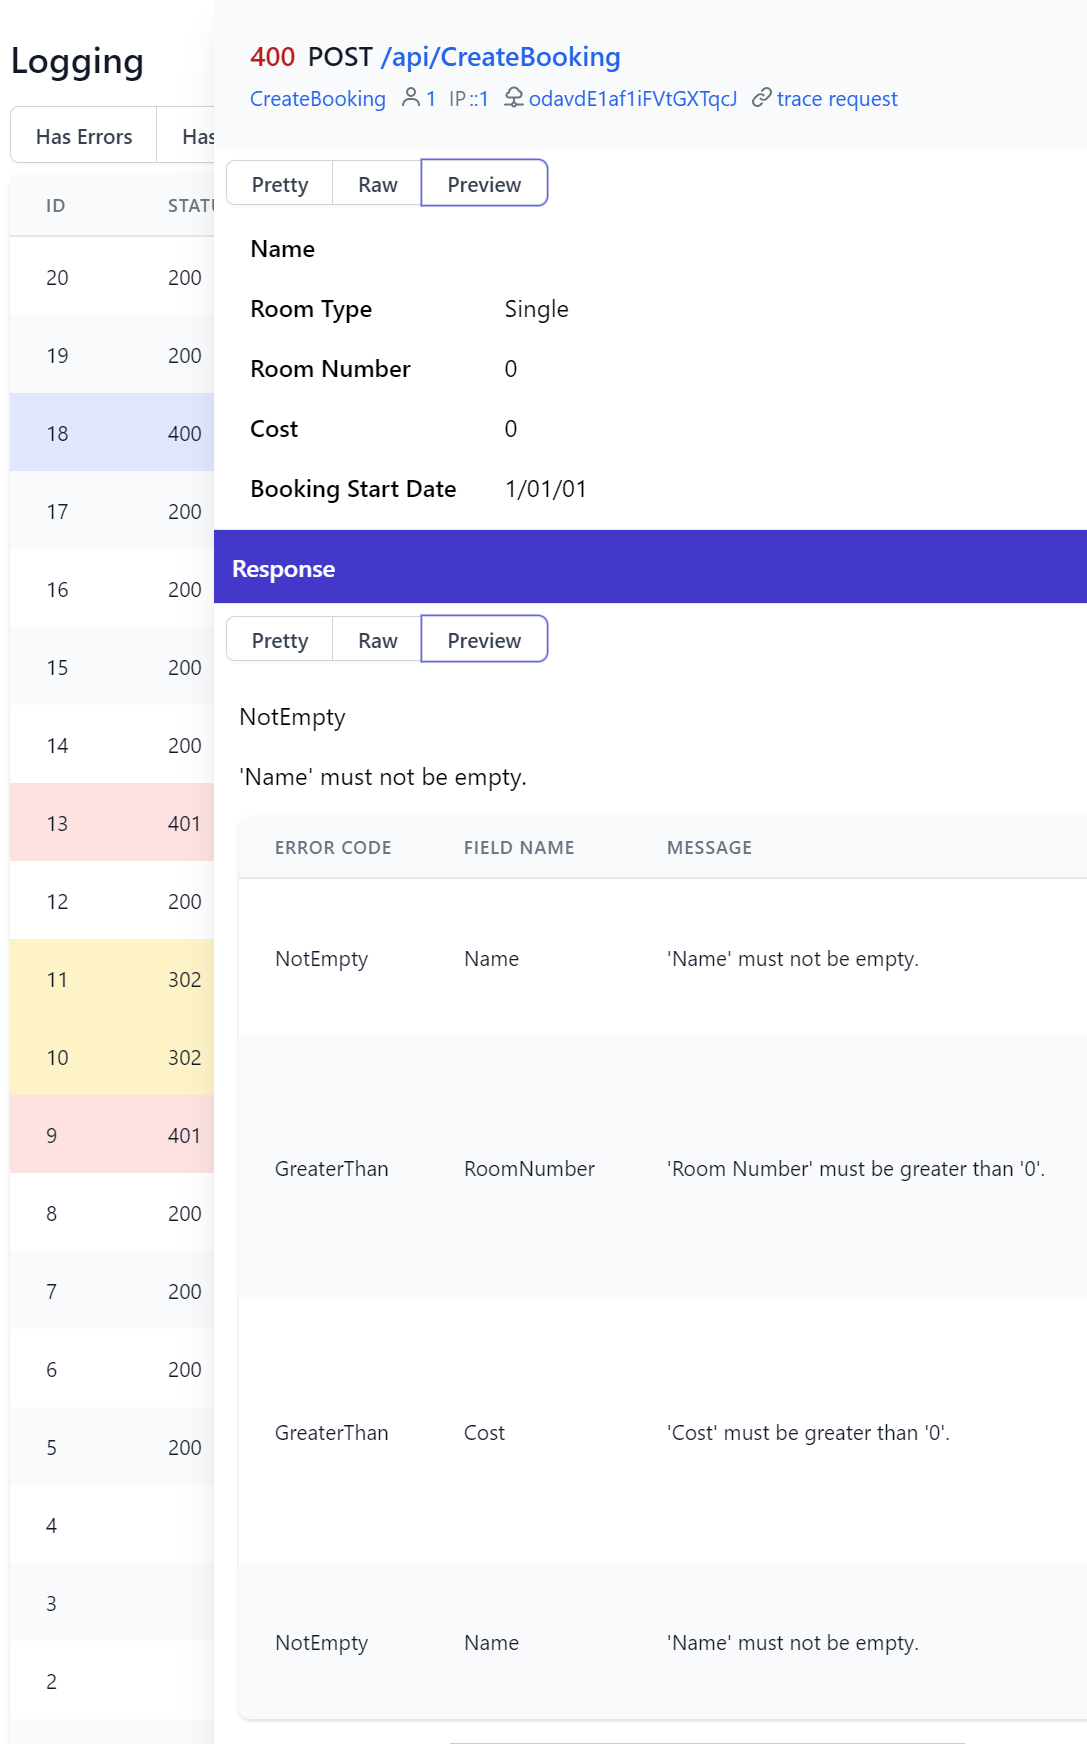
Ok, so the Admin User (identified from JWT info) tried to create an empty booking which was rejected by its server declarative validation rules which sees these context validation errors surfaced into Locode's UI:
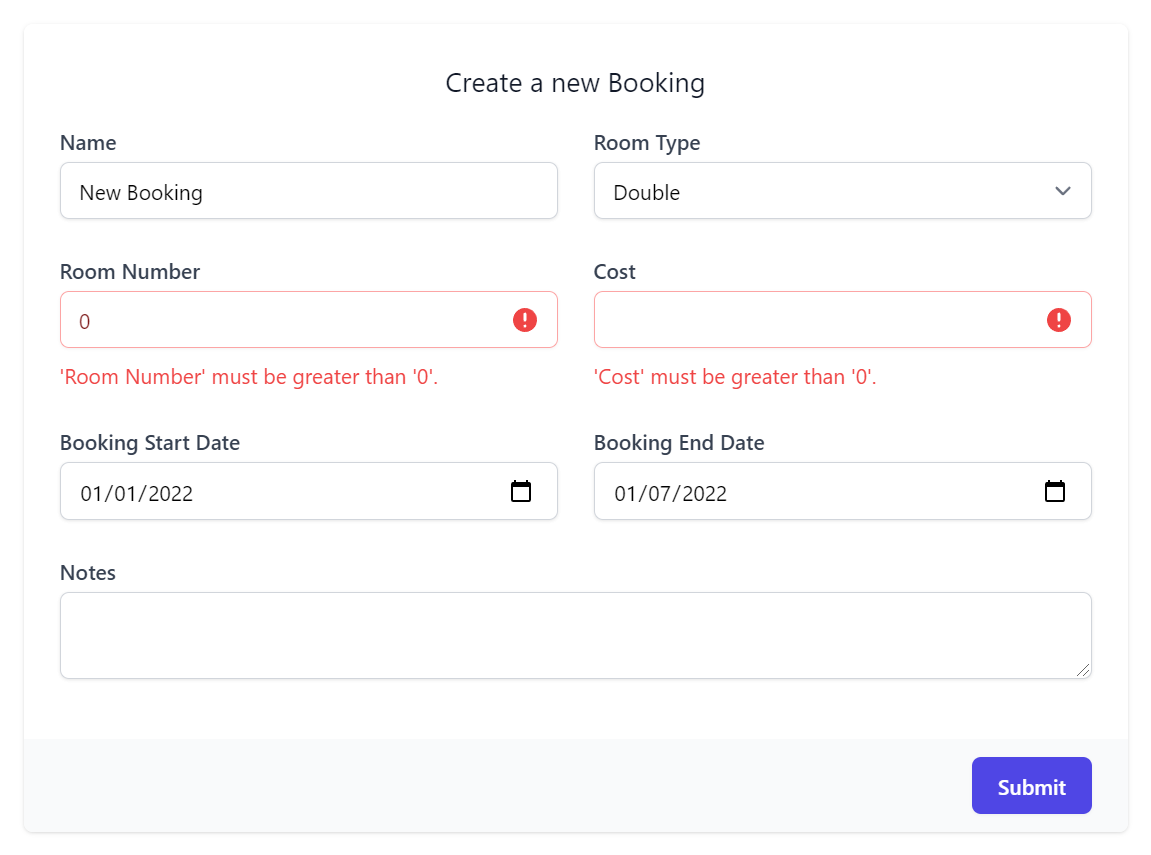
We can then see this was quickly rectified in the next request with a successful Booking submitted:
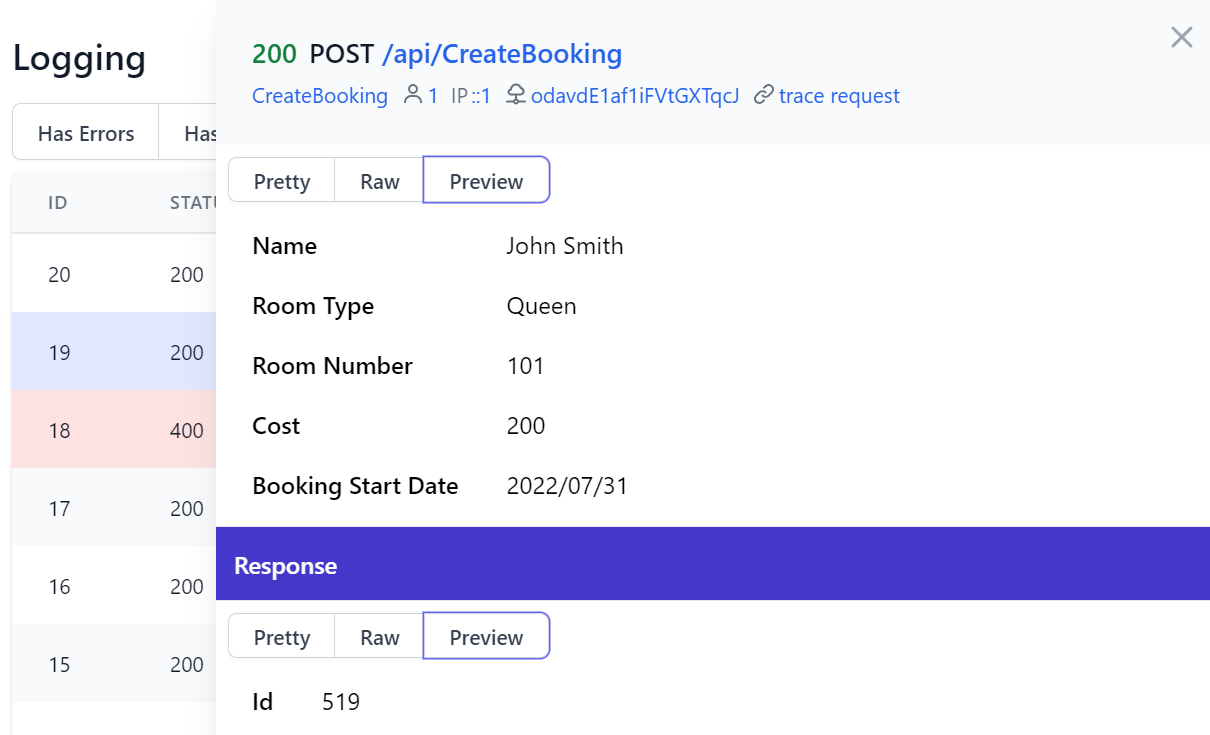
Clicking on trace request we can see all the diagnostic events performed in this API request within the RequestBefore and RequestAfter events which took 0.07s to complete.
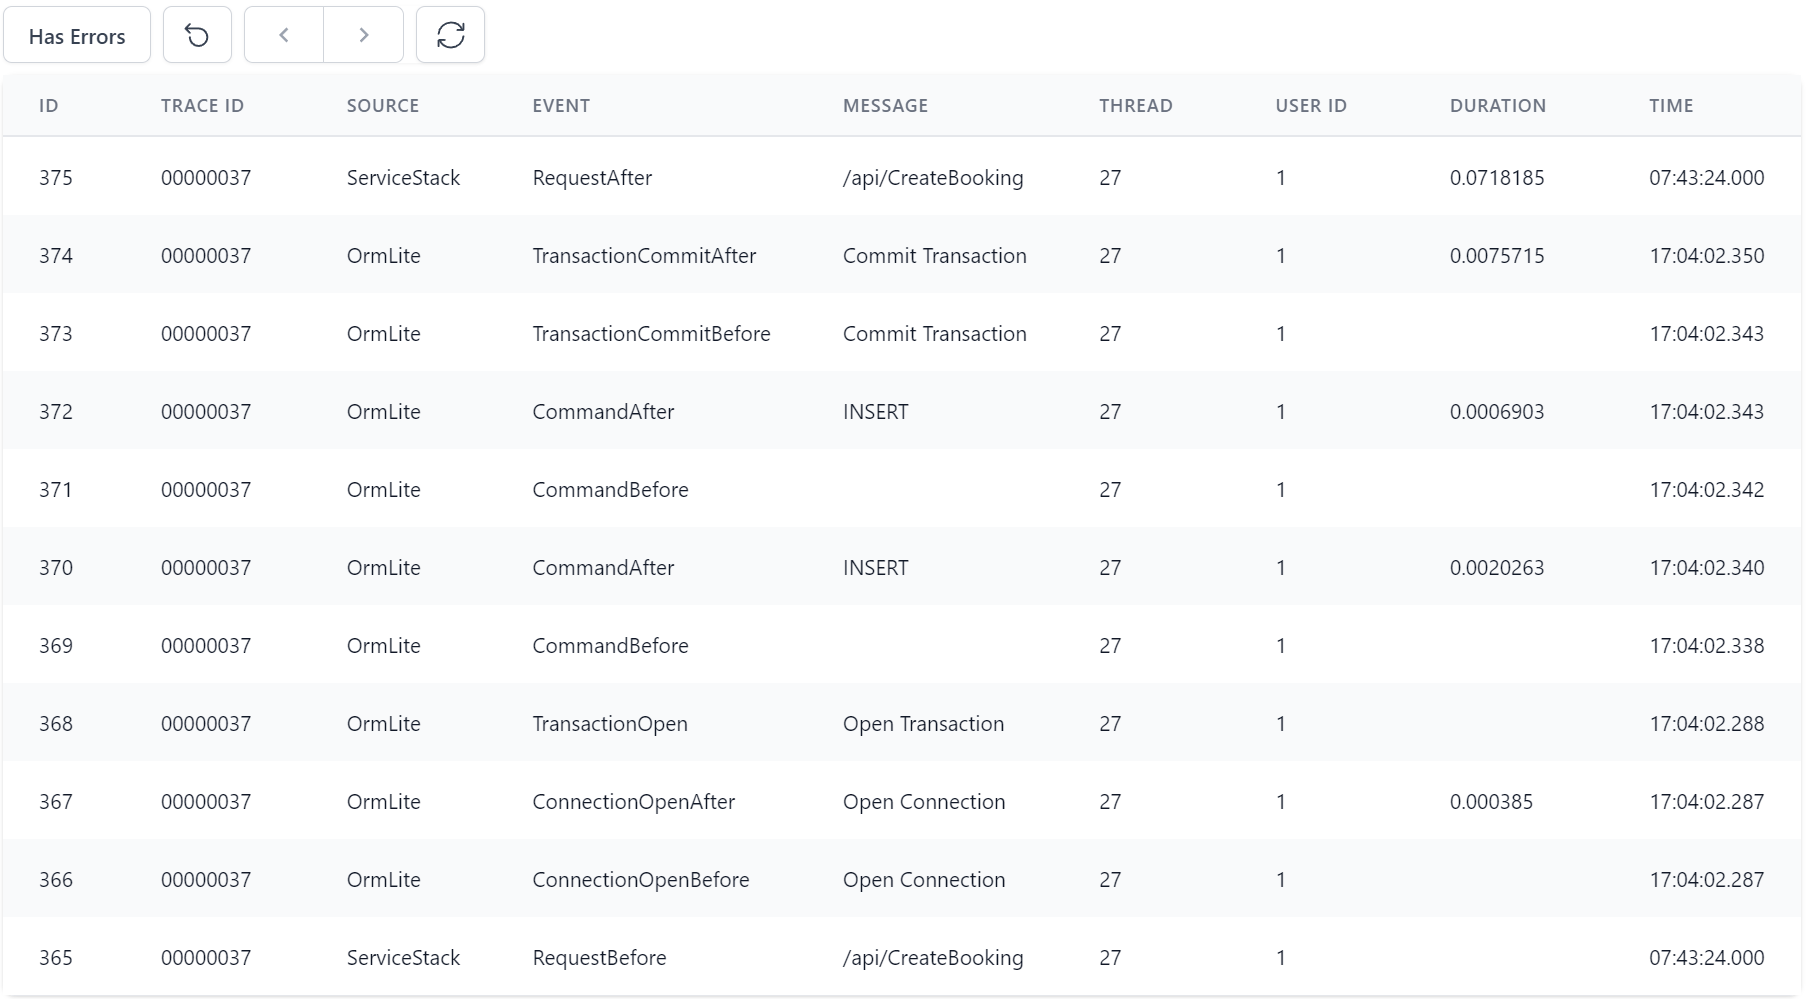
Profiling UI
Following diagnostic conventions you'll typically see 2 entries for each event, created before and after each action, measuring the duration and capturing the last event before any error occurred.
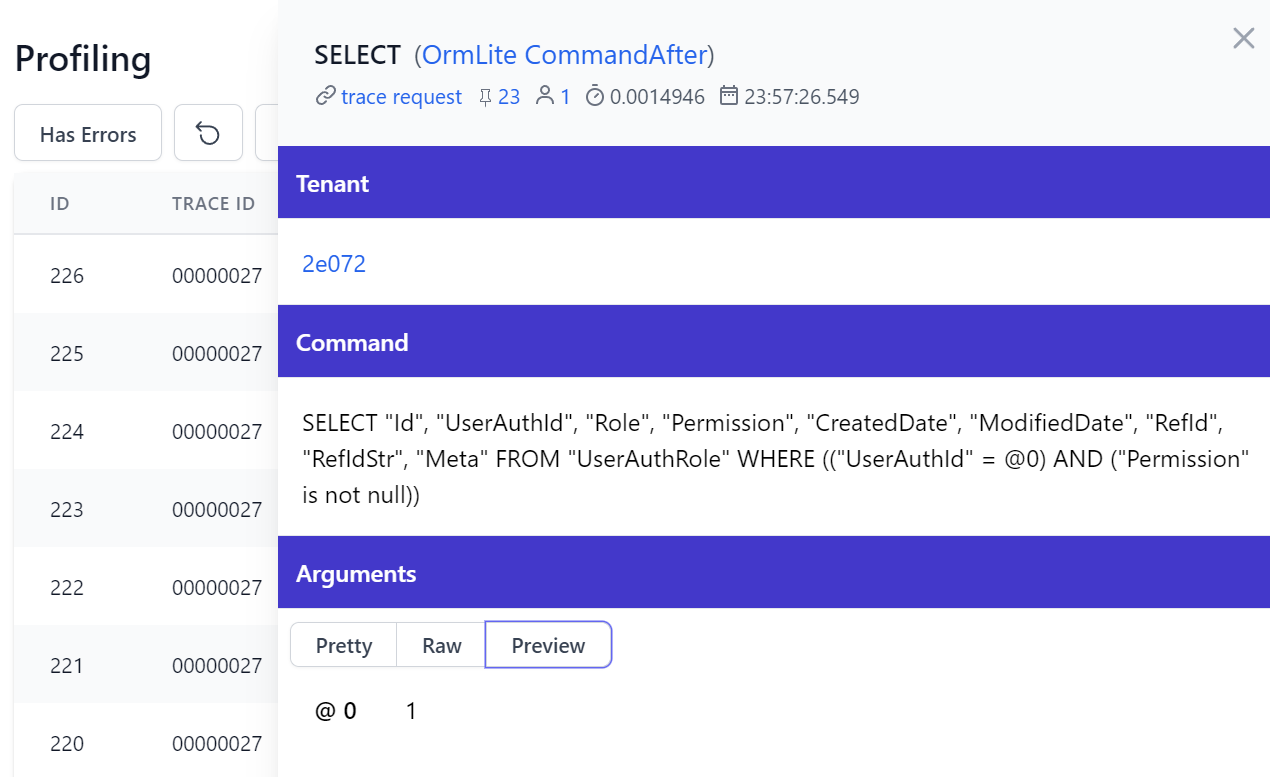
SQL Profiling
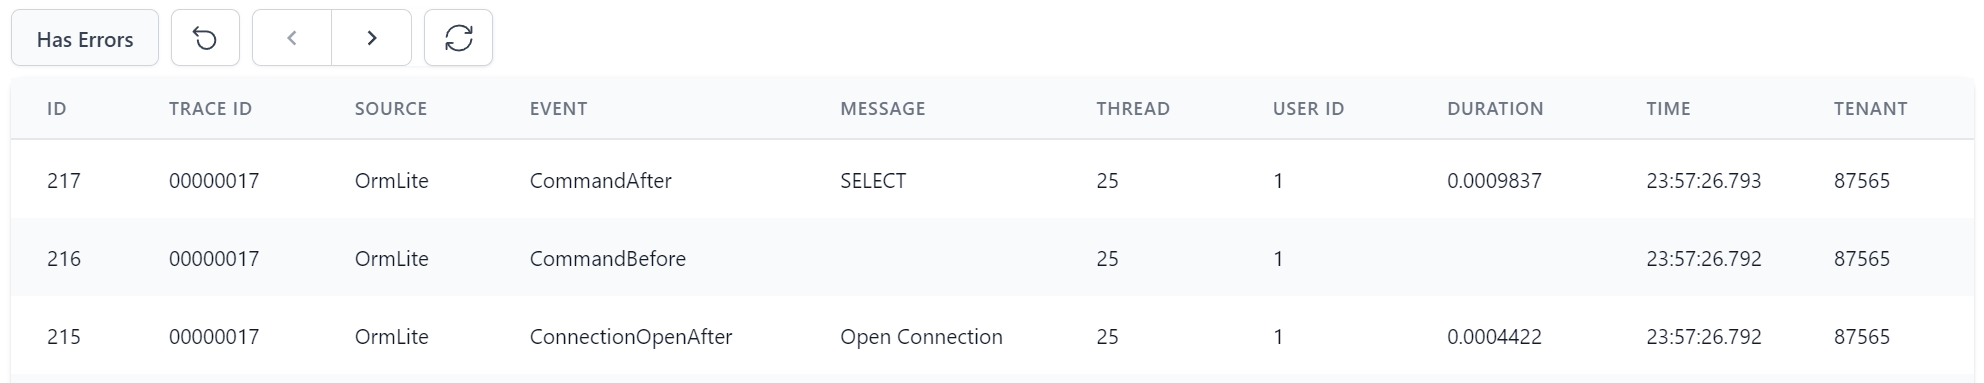
Clicking on an entry will show more useful contextual information captured for each event, e.g. if you click on OrmLite's CommandAfter event you'll be able to see the generated SQL + Params executed by OrmLite:
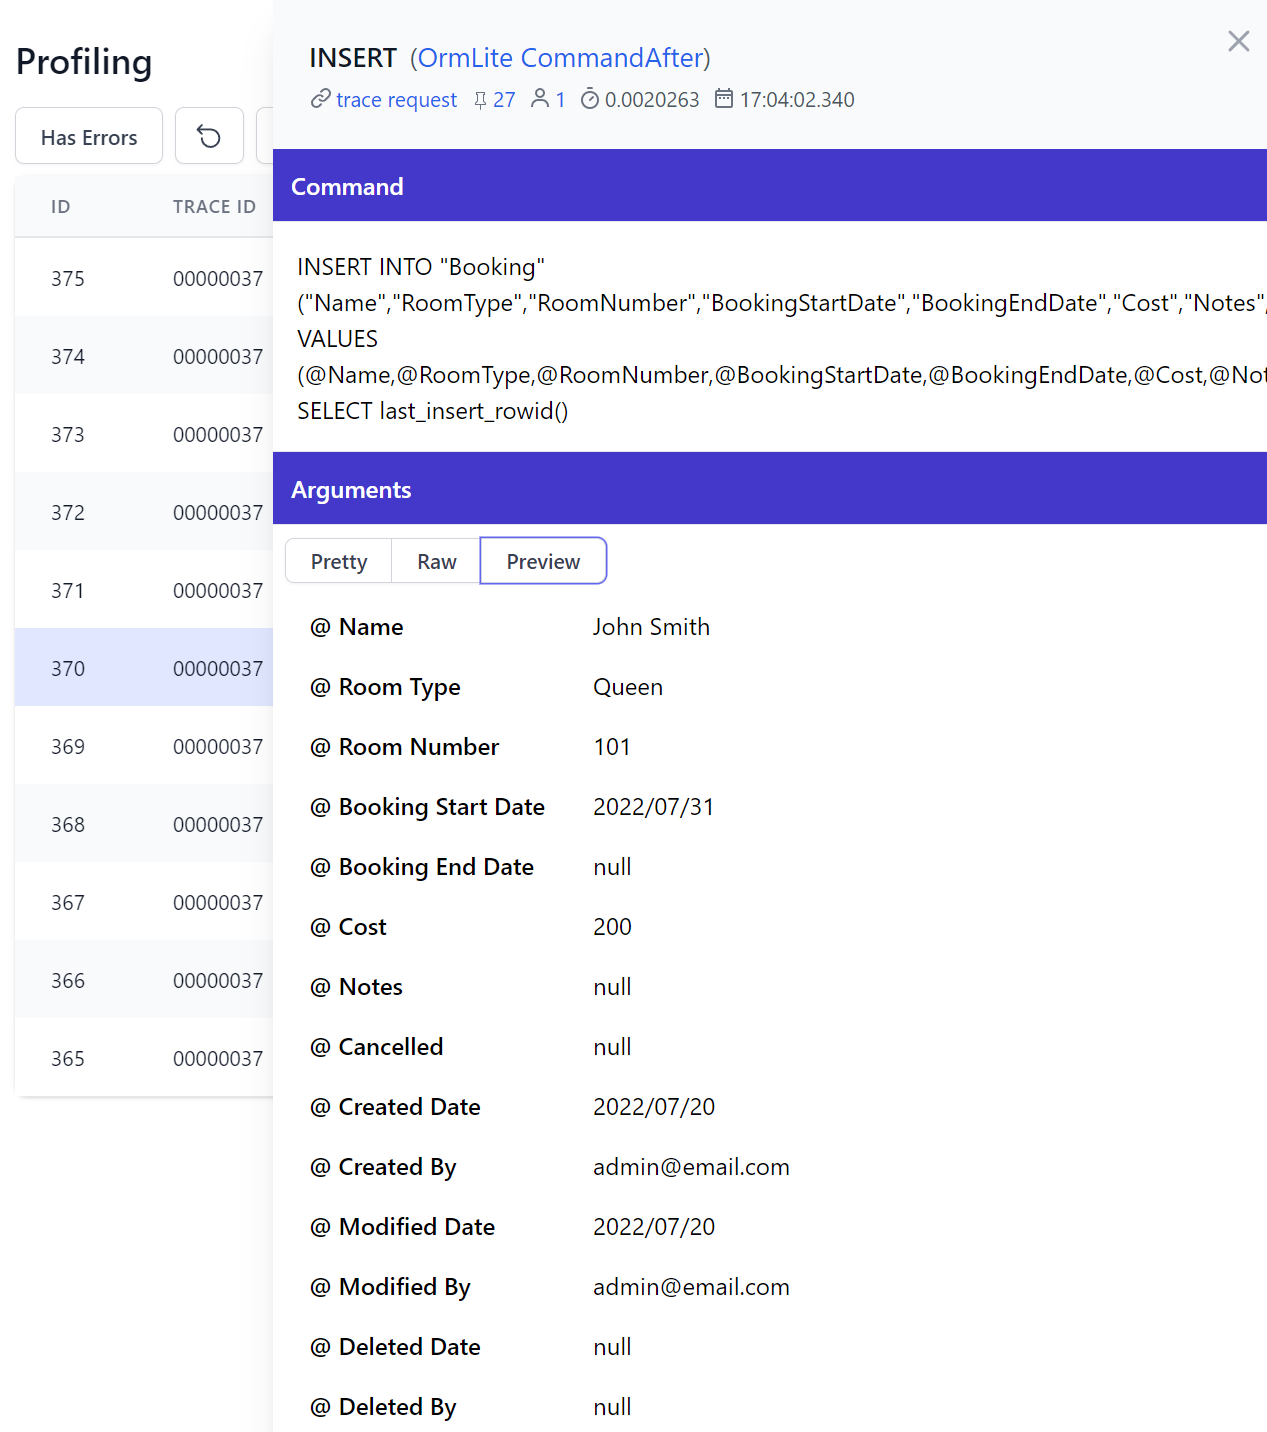
The profiling detail view also contains blue links to filter matching diagnostic events and showing useful information like the Thread, User this command was executed by as well as the duration and timestamp when it occurred.
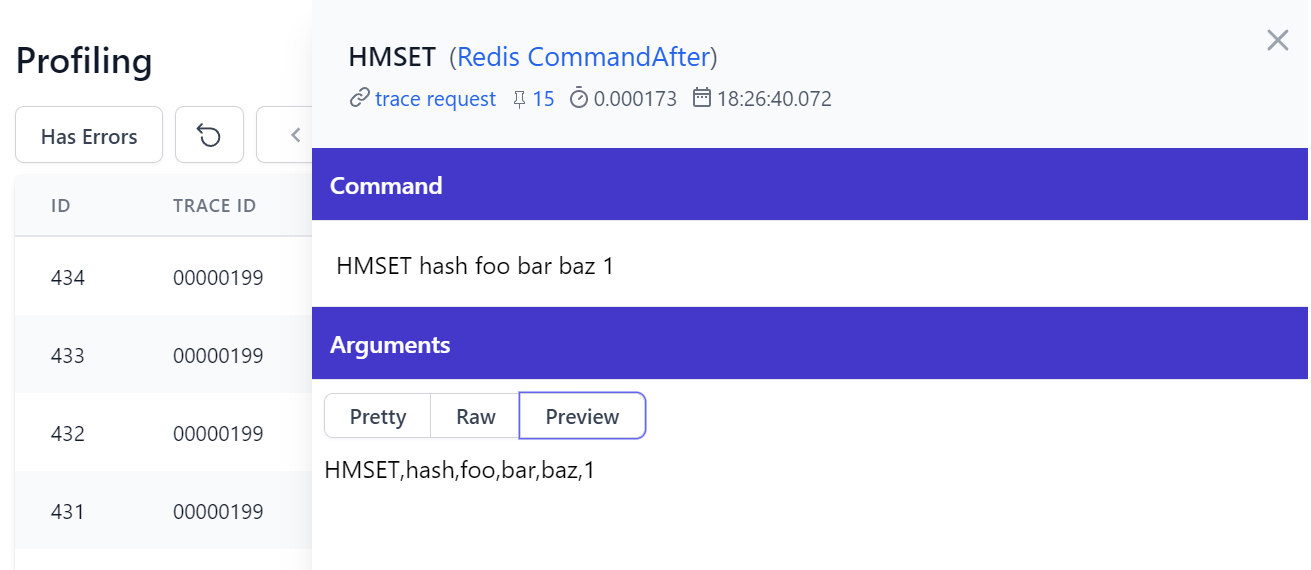
Redis Profiling
Redis simpler commands are captured in a list of arguments:
Purchase API Events Example
Surfacing the high-level events of your service implementations provides a new observability perspective that's harder to infer from trying to follow the details in the code.
For example our Order Page generated over 150+ events capturing all the SQL commands to store order, subscription, customer, payment information and generated License and Order confirmation emails, HttpClient integration requests with Stripe and MQ requests for sending emails in a Background MQ Worker thread.
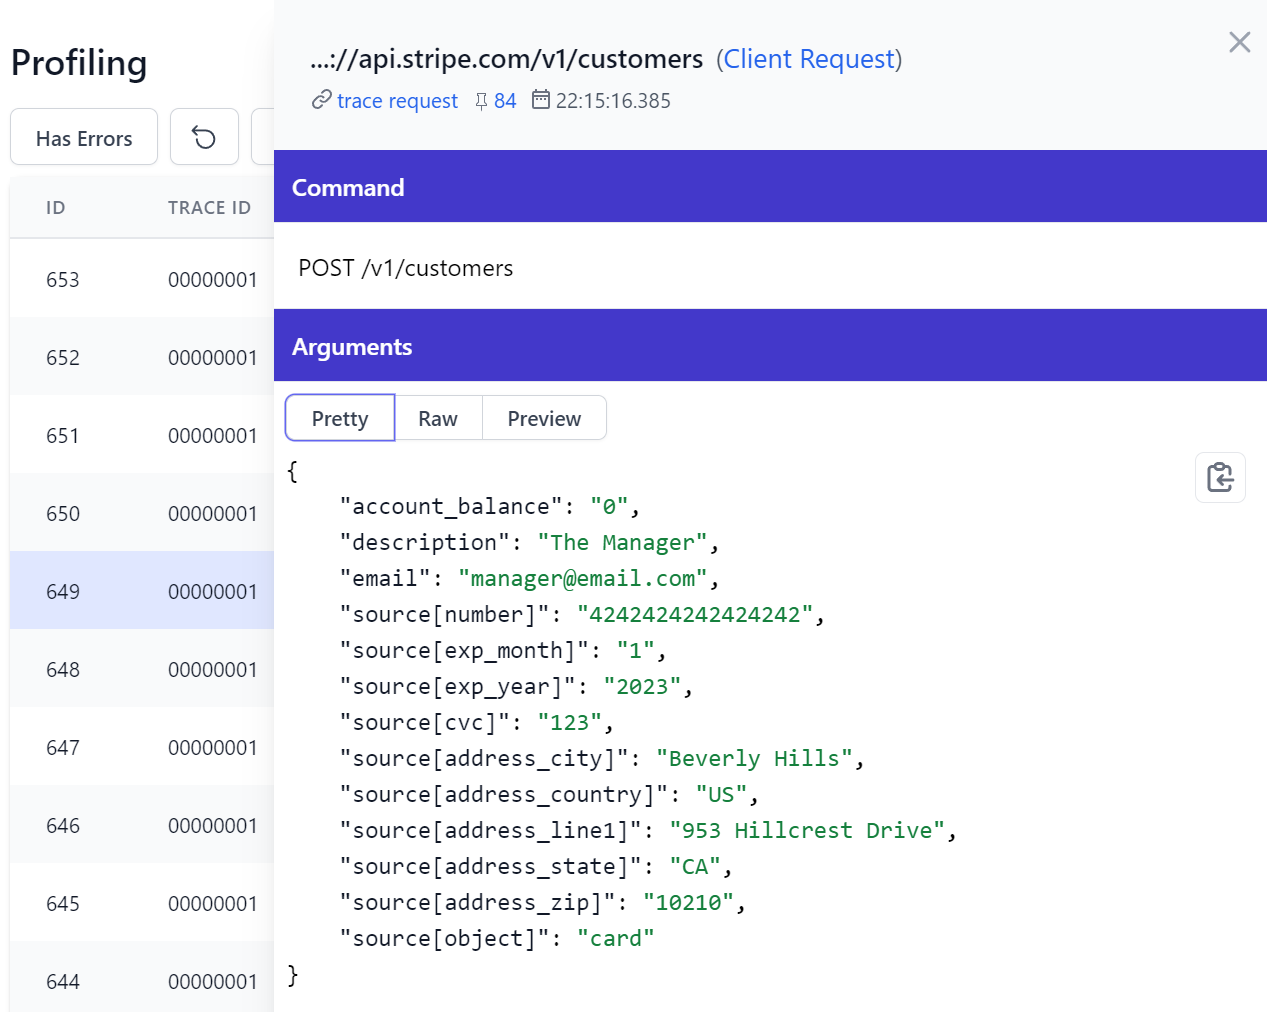
HttpClient Profiling
HttpClient profiling is implemented a little differently then other events in that it builds on the existing HttpClient diagnostic events so it's able to capture general usage of .NET's HttpClient, which is how it's able to capture our integration with Stripe:
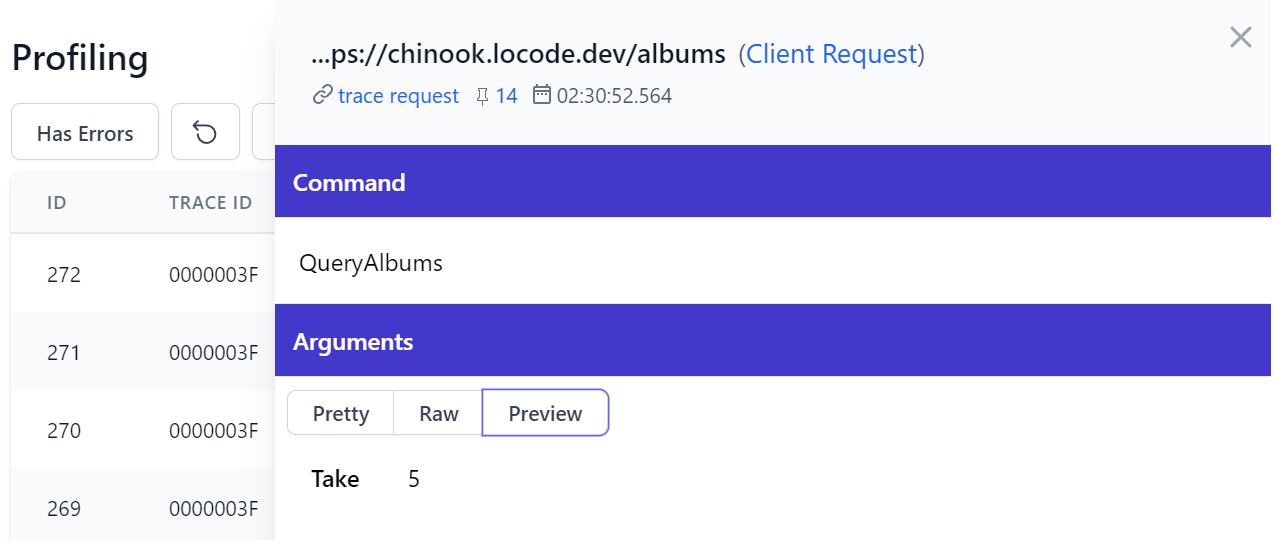
JsonApiClient Profiling
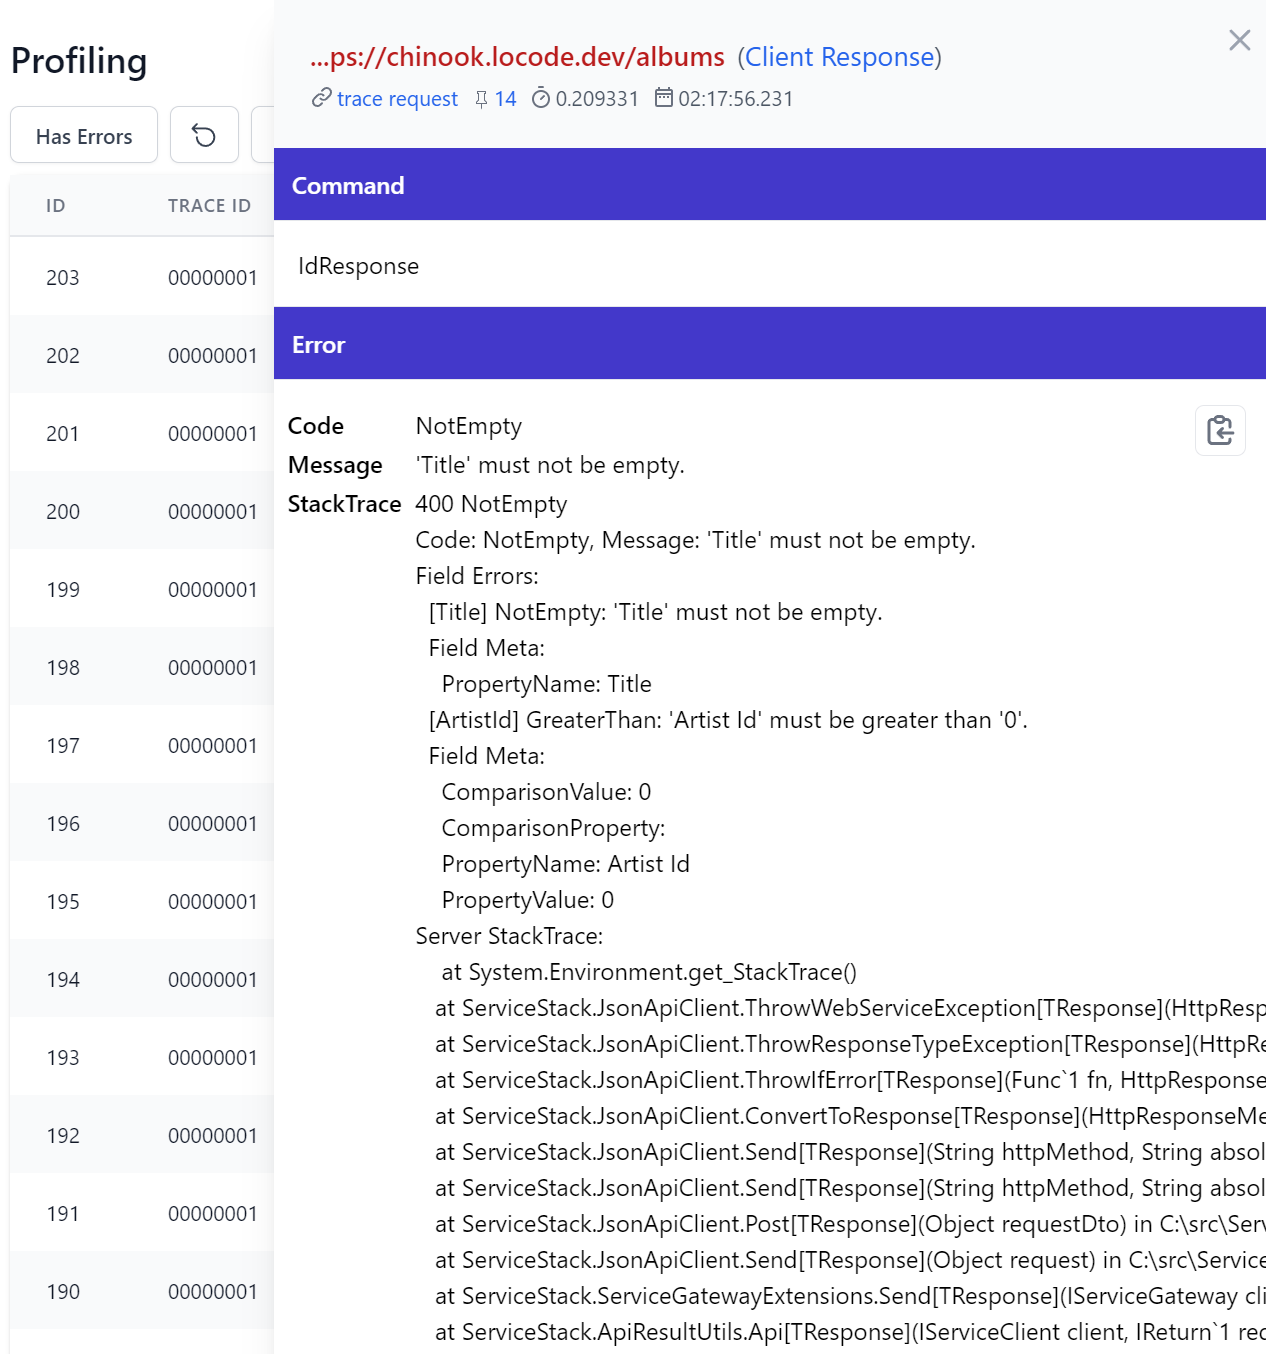
Although we're able to provide richer profiling for our .NET 10+ JsonApiClient which has access to typed Request DTOs for submitting API Requests:
As well as Response DTOs returned in API Responses:
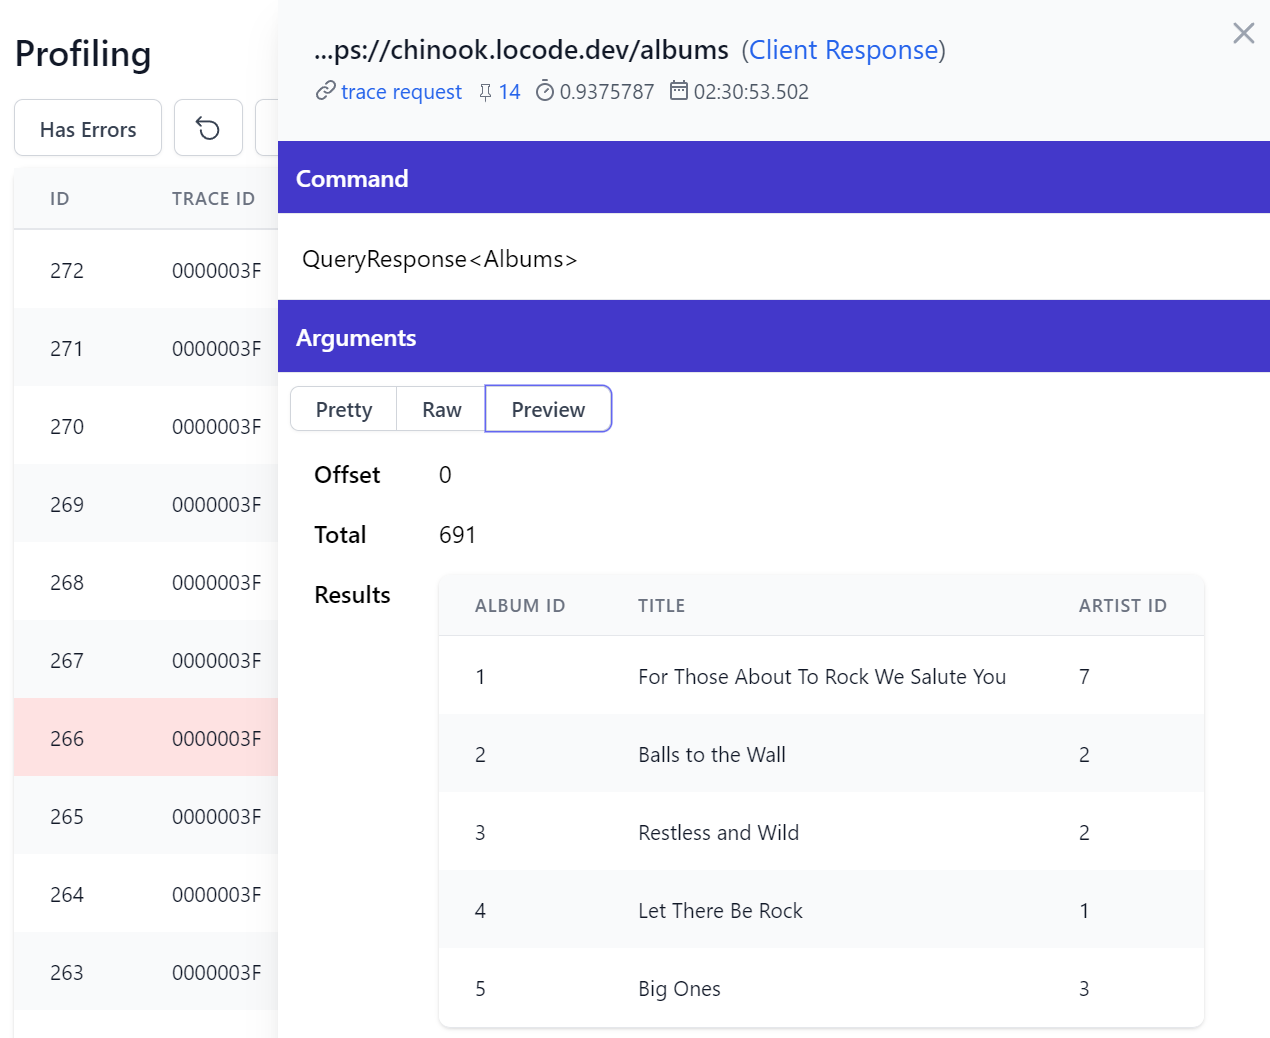
We also can examine API Error responses in richer detail, e.g:
MQ Profiling
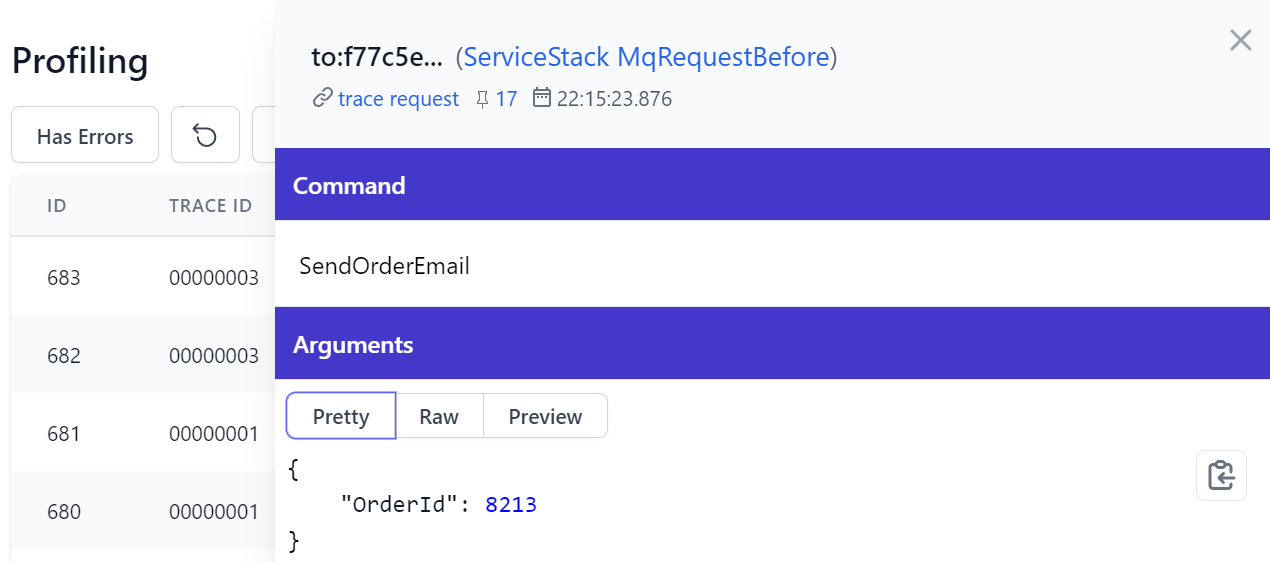
Since they execute APIs on an entirely different endpoint and worker threads, MQ Requests are tracked independently from HTTP APIs starting their own diagnostic Activity which enables being able to trace all events generated from an MQ Request. Here's an example used to handle sending customer emails:
Service Gateway Profiling
The Service Gateway leverages ServiceStack's message-based design to enable loosely-coupled service integrations enabling systems to split into Microservices without needing to change any of the internal services consuming them. As they're not RPC invocations their messages are introspectable and can be observed in the Profiling UI:
Profile Custom Info
We've made it easy to add a custom tracking field with the same functionality as the primary fields where they can be sorted and filtered. This could be used to attach a Tenant Id to the profiling information by providing a Label and Resolver function to resolve it, e.g:
new ProfilingFeature {
    TagLabel = "Tenant",
    TagResolver = req => MyResolveTenant(req),
}
Where it will be displayed in all profiling results, e.g:
TIP
The number and order of fields can be customized in SummaryFields collection in ProfilingFeature
This custom info also appears in the detail page as a link which can be used to filter events with the same tenant id:
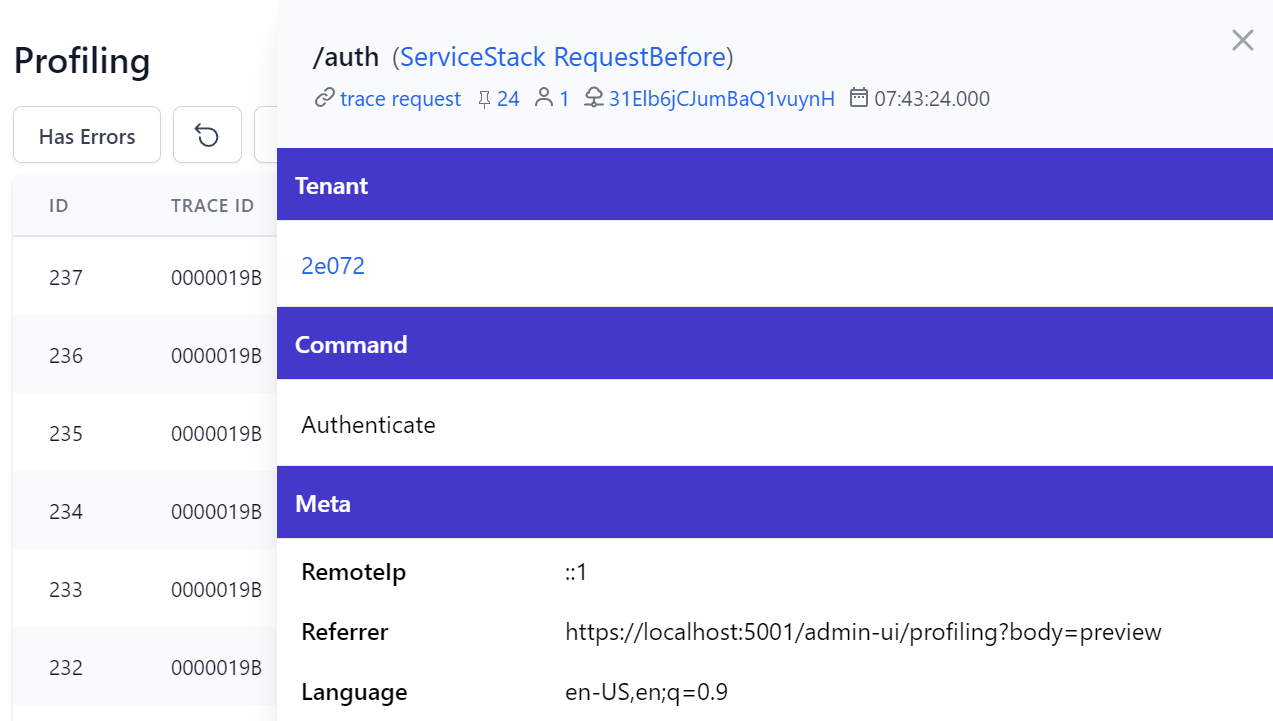
Profile Custom Metadata
You're also able to capture custom information for different events and have them appear in the detail page, e.g:
new ProfilingFeature {
    DiagnosticEntryFilter = (entry, evt) => {
        if (evt is RequestDiagnosticEvent requestEvent)
        {
            var req = requestEvent.Request;
            entry.Meta = new() {
                ["RemoteIp"] = req.RemoteIp,
                ["Referrer"] = req.UrlReferrer?.ToString(),
                ["Language"] = req.GetHeader(HttpHeaders.AcceptLanguage),
            };
        }
    },
}
Where it will be populated in the Meta section arguments:
Access Diagnostic Events in Code
In addition to powering the profiling UI, the diagnostic events added throughout ServiceStack can be observed in code to tap in and inspect when these diagnostic events occur. It follows the standard Diagnostic Source model where you specify which listeners you want observed in OnNext(DiagnosticListener) that you can then access in OnNext(KeyValuePair<string,object>).
Microsoft's Diagnostic Events like HttpClient uses anonymous classes making them unnecessarily difficult to access, which can be made easier by using our Reflection Utils ToObjectDictionary().
As they offer better utility, we've opted to use idiomatic strong types and string constants instead where they're better accessible from C#.
You can use this skeleton class for a quick way to get started showing how to subscribe to all ServiceStack Diagnostic Sources and the event names and types to handle all profiling events:
// Register your Diagnostic Observer
var observer = new MyDiagnosticObserver();
var subscription = DiagnosticListener.AllListeners.Subscribe(observer);

public sealed class MyDiagnosticObserver :
    IObserver<DiagnosticListener>,
    IObserver<KeyValuePair<string, object>>
{
    private readonly List<IDisposable> subscriptions = new();

    /* Specify which Profiling Events you want to observe */
    void IObserver<DiagnosticListener>.OnNext(DiagnosticListener diagnosticListener)
    {
        if (diagnosticListener.Name is Diagnostics.Listeners.ServiceStack
         || diagnosticListener.Name is Diagnostics.Listeners.OrmLite
         || diagnosticListener.Name is Diagnostics.Listeners.Redis
         || diagnosticListener.Name is Diagnostics.Listeners.Client
         || diagnosticListener.Name is Diagnostics.Listeners.HttpClient)
        {
            var subscription = diagnosticListener.Subscribe(this);
            subscriptions.Add(subscription);
        }
    }

    /* Handle Profiling Events */
    public void OnNext(KeyValuePair<string, object> kvp)
    {
        /** ServiceStack */
        /*** Request */
        if (kvp.Key == Diagnostics.Events.ServiceStack.WriteRequestBefore && kvp.Value is RequestDiagnosticEvent reqBefore) { /*...*/ }
        if (kvp.Key == Diagnostics.Events.ServiceStack.WriteRequestAfter && kvp.Value is RequestDiagnosticEvent reqAfter) { /*...*/ }
        if (kvp.Key == Diagnostics.Events.ServiceStack.WriteRequestError && kvp.Value is RequestDiagnosticEvent reqError) { /*...*/ }

        /*** Gateway */
        if (kvp.Key == Diagnostics.Events.ServiceStack.WriteGatewayBefore && kvp.Value is RequestDiagnosticEvent gatewayBefore) { /*...*/ }
        if (kvp.Key == Diagnostics.Events.ServiceStack.WriteGatewayAfter && kvp.Value is RequestDiagnosticEvent gatewayAfter) { /*...*/ }
        if (kvp.Key == Diagnostics.Events.ServiceStack.WriteGatewayError && kvp.Value is RequestDiagnosticEvent gatewayError) { /*...*/ }

        /*** MQ */
        if (kvp.Key == Diagnostics.Events.ServiceStack.WriteMqRequestBefore && kvp.Value is MqRequestDiagnosticEvent mqReqBefore) { /*...*/ }
        if (kvp.Key == Diagnostics.Events.ServiceStack.WriteMqRequestAfter && kvp.Value is MqRequestDiagnosticEvent mqReqAfter) { /*...*/ }
        if (kvp.Key == Diagnostics.Events.ServiceStack.WriteMqRequestError && kvp.Value is MqRequestDiagnosticEvent mqReqError) { /*...*/ }
        if (kvp.Key == Diagnostics.Events.ServiceStack.WriteMqRequestPublish && kvp.Value is MqRequestDiagnosticEvent mqReqPublish) { /*...*/ }

        /** Client */
        if (kvp.Key == Diagnostics.Events.Client.WriteRequestBefore && kvp.Value is HttpClientDiagnosticEvent clientBefore) { /*...*/ }
        if (kvp.Key == Diagnostics.Events.Client.WriteRequestAfter && kvp.Value is HttpClientDiagnosticEvent clientAfter) { /*...*/ }
        if (kvp.Key == Diagnostics.Events.Client.WriteRequestError && kvp.Value is HttpClientDiagnosticEvent clientError) { /*...*/ }

        /** HttpClient */
        if (kvp.Key == Diagnostics.Events.HttpClient.OutStart)
        {
            var obj = kvp.Value.ToObjectDictionary();
        }
        if (kvp.Key == Diagnostics.Events.HttpClient.Request)
        {
            var obj = kvp.Value.ToObjectDictionary();
        }
        if (kvp.Key == Diagnostics.Events.HttpClient.OutStop)
        {
             var obj = kvp.Value.ToObjectDictionary();
        }
        if (kvp.Key == Diagnostics.Events.HttpClient.Response)
        {
            var obj = kvp.Value.ToObjectDictionary();
        }

        /** OrmLite */
        if (kvp.Key == Diagnostics.Events.OrmLite.WriteCommandBefore && kvp.Value is OrmLiteDiagnosticEvent dbBefore) { /*...*/ }
        if (kvp.Key == Diagnostics.Events.OrmLite.WriteCommandAfter && kvp.Value is OrmLiteDiagnosticEvent dbAfter) { /*...*/ }
        if (kvp.Key == Diagnostics.Events.OrmLite.WriteCommandError && kvp.Value is OrmLiteDiagnosticEvent dbError) { /*...*/ }

        /*** OrmLite Connections */
        if (kvp.Key == Diagnostics.Events.OrmLite.WriteConnectionOpenBefore && kvp.Value is OrmLiteDiagnosticEvent dbOpenBefore) { /*...*/ }
        if (kvp.Key == Diagnostics.Events.OrmLite.WriteConnectionOpenAfter && kvp.Value is OrmLiteDiagnosticEvent dbOpenAfter) { /*...*/ }
        if (kvp.Key == Diagnostics.Events.OrmLite.WriteConnectionOpenError && kvp.Value is OrmLiteDiagnosticEvent dbOpenError) { /*...*/ }
        if (kvp.Key == Diagnostics.Events.OrmLite.WriteConnectionCloseBefore && kvp.Value is OrmLiteDiagnosticEvent dbCloseBefore) { /*...*/ }
        if (kvp.Key == Diagnostics.Events.OrmLite.WriteConnectionCloseAfter && kvp.Value is OrmLiteDiagnosticEvent dbCloseAfter) { /*...*/ }
        if (kvp.Key == Diagnostics.Events.OrmLite.WriteConnectionCloseError && kvp.Value is OrmLiteDiagnosticEvent dbCloseError) { /*...*/ }

        /*** OrmLite Transactions */
        if (kvp.Key == Diagnostics.Events.OrmLite.WriteTransactionOpen && kvp.Value is OrmLiteDiagnosticEvent commitOpen) { /*...*/ }
        if (kvp.Key == Diagnostics.Events.OrmLite.WriteTransactionCommitBefore && kvp.Value is OrmLiteDiagnosticEvent commitBefore) { /*...*/ }
        if (kvp.Key == Diagnostics.Events.OrmLite.WriteTransactionCommitAfter && kvp.Value is OrmLiteDiagnosticEvent commitAfter) { /*...*/ }
        if (kvp.Key == Diagnostics.Events.OrmLite.WriteTransactionCommitError && kvp.Value is OrmLiteDiagnosticEvent commitError) { /*...*/ }
        if (kvp.Key == Diagnostics.Events.OrmLite.WriteTransactionRollbackBefore && kvp.Value is OrmLiteDiagnosticEvent rollbackBefore) { /*...*/ }
        if (kvp.Key == Diagnostics.Events.OrmLite.WriteTransactionRollbackAfter && kvp.Value is OrmLiteDiagnosticEvent rollbackAfter) { /*...*/ }
        if (kvp.Key == Diagnostics.Events.OrmLite.WriteTransactionRollbackError && kvp.Value is OrmLiteDiagnosticEvent rollbackError) { /*...*/ }

        /** Redis */
        if (kvp.Key == Diagnostics.Events.Redis.WriteCommandBefore && kvp.Value is RedisDiagnosticEvent redisBefore) { /*...*/ }
        if (kvp.Key == Diagnostics.Events.Redis.WriteCommandRetry && kvp.Value is RedisDiagnosticEvent redisRetry) { /*...*/ }
        if (kvp.Key == Diagnostics.Events.Redis.WriteCommandAfter && kvp.Value is RedisDiagnosticEvent redisAfter) { /*...*/ }
        if (kvp.Key == Diagnostics.Events.Redis.WriteCommandError && kvp.Value is RedisDiagnosticEvent redisError) { /*...*/ }

        /*** Redis Connections */
        if (kvp.Key == Diagnostics.Events.Redis.WriteConnectionOpenBefore && kvp.Value is RedisDiagnosticEvent redisOpenBefore) { /*...*/ }
        if (kvp.Key == Diagnostics.Events.Redis.WriteConnectionOpenAfter && kvp.Value is RedisDiagnosticEvent redisOpenAfter) { /*...*/ }
        if (kvp.Key == Diagnostics.Events.Redis.WriteConnectionOpenError && kvp.Value is RedisDiagnosticEvent redisOpenError) { /*...*/ }
        if (kvp.Key == Diagnostics.Events.Redis.WriteConnectionCloseBefore && kvp.Value is RedisDiagnosticEvent redisCloseBefore) { /*...*/ }
        if (kvp.Key == Diagnostics.Events.Redis.WriteConnectionCloseAfter && kvp.Value is RedisDiagnosticEvent redisCloseAfter) { /*...*/ }
        if (kvp.Key == Diagnostics.Events.Redis.WriteConnectionCloseError && kvp.Value is RedisDiagnosticEvent redisCloseError) { /*...*/ }

        /*** Redis Pools */
        if (kvp.Key == Diagnostics.Events.Redis.WritePoolRent && kvp.Value is RedisDiagnosticEvent redisPoolBefore) { /*...*/ }
        if (kvp.Key == Diagnostics.Events.Redis.WritePoolReturn && kvp.Value is RedisDiagnosticEvent redisPoolAfter) { /*...*/ }
    }

    void IObserver<DiagnosticListener>.OnCompleted()
    {
        subscriptions.ForEach(x => x.Dispose());
        subscriptions.Clear();
    }
    public void OnCompleted() {}
    void IObserver<DiagnosticListener>.OnError(Exception error) {}
    public void OnError(Exception error) {}
}
Request Logs Configuration
The Request Logs feature has a number of configuration options controlling which requests are logged and the level of logging captured about them.
class RequestLogsFeature
{
    // Limit API access to users in role
    string AccessRole = RoleNames.Admin;

    // RequestLogs service Route, default is /requestlogs
    string AtRestPath = "/requestlogs";

    // Size of memory logger circular buffer
    int? Capacity;

    // Turn On/Off Session Tracking
    bool EnableSessionTracking;

    // Turn On/Off Logging of Raw Request Body, default is Off
    bool EnableRequestBodyTracking;

    // Turn On/Off Raw Request Body Tracking per-request
    Func<IRequest, bool> RequestBodyTrackingFilter;

    // Turn On/Off Tracking of Responses
    bool EnableResponseTracking = false;

    // Turn On/Off Tracking of Responses per-request
    Func<IRequest, bool> ResponseTrackingFilter;

    // Turn On/Off Tracking of Exceptions
    bool EnableErrorTracking = true;

    // Don't log matching requests
    Func<IRequest, bool> SkipLogging;

    // Change the RequestLogger provider. Default is InMemoryRollingRequestLogger
    IRequestLogger RequestLogger;

    // Don't log requests of these types. By default RequestLog's are excluded
    Type[] ExcludeRequestDtoTypes;

    // Don't log request body's for services with sensitive information.
    // By default Auth and Registration requests are hidden.
    Type[] HideRequestBodyForRequestDtoTypes;

    // Don't log Response DTO Types
    Type[] ExcludeResponseTypes;

    // Limit logging to only Service Requests
    bool LimitToServiceRequests = true;

    // Customize Request Log Entry
    Action<IRequest, RequestLogEntry> RequestLogFilter;

    // Ignore logging and serializing these Request DTOs
    List<Type> IgnoreTypes; = new();

    // Use custom Ignore Request DTO predicate
    Func<object,bool> IgnoreFilter = DefaultIgnoreFilter;

    // Default take, if none is specified
    int DefaultLimit = 100;

    // Change what DateTime to use for the current Date (defaults to UtcNow)
    Func<DateTime> CurrentDateFn = () => DateTime.UtcNow;
}
Profiling Configuration
The ProfilingFeature offers similar functionality in specifying which sources to observe and profiling events to capture as well as options for customizing the Profiling UI, e.g you can limit generating & capturing diagnostic events to just OrmLite and Redis with:
Plugins.Add(new ProfilingFeature {
    Profile = ProfileSource.OrmLite | ProfileSource.Redis
});
For further configuration options see the documented plugin below:
[Flags]
enum ProfileSource
{
    None         = 0,
    ServiceStack = 1 << 0,
    Client       = 1 << 1,
    Redis        = 1 << 2,
    OrmLite      = 1 << 3,
    All          = ServiceStack | Client | OrmLite | Redis,
}

class ProfilingFeature
{
    // Limit API access to users in role
    string AccessRole = RoleNames.Admin;

    // Which features to Profile, default all
    ProfileSource Profile = ProfileSource.All;

    // Size of circular buffer of profiled events
    int Capacity = 10000;

    // Don't log requests of these types. By default Profiling/Metadata requests are excluded
    List<Type> ExcludeRequestDtoTypes = new();

    // Don't log requests from these path infos prefixes
    List<string> ExcludeRequestPathInfoStartingWith = new();

    // Turn On/Off Tracking of Responses per-request
    Func<IRequest, bool>? ExcludeRequestsFilter;

    // Don't log request body's for services with sensitive information.
    // By default Auth and Registration requests are hidden.
    List<Type> HideRequestBodyForRequestDtoTypes = new();

    // Don't log Response DTO Types
    List<Type> ExcludeResponseTypes = new();

    // Turn On/Off Tracking of Responses per-request
    Func<IRequest, bool>? ResponseTrackingFilter;

    // Whether to include CallStack StackTrace
    bool? IncludeStackTrace;

    // Attach custom data to request profiling summary fields
    Func<IRequest,string?>? TagResolver;

    // Label to show for custom tag
    string? TagLabel;

    // The properties displayed in Profiling UI results grid
    List<string> SummaryFields;

    // Default take, if none is specified
    int DefaultLimit = 50;

    // Customize DiagnosticEntry that gets captured
    Action<DiagnosticEntry, DiagnosticEvent>? DiagnosticEntryFilter;

    // Maximum char/byte length of string response body
    int MaxBodyLength = 10 * 10 * 1024;
}