Try the built-in Admin Logging & Profiling UI
For a better integrated alternative to Mini Profiler checkout the built-in Admin Logging & Profiling UI.
MVC Mini Profiler
ServiceStack's HTML5 JSON Report Format also includes the Mvc Mini Profiler - by @jarrod_dixon and @samsaffron. It's the same profiler used to profile and help speed up sites like Stack Overflow and more recently the much faster NuGet v2.0 website.
The MVC Mini Profiler plugin is only available for classic ASP.NET Framework Web Apps, for .NET Core Apps you can use the official MiniProfiler.AspNetCore.Mvc NuGet package, please see this community post for details:
Using the MVC Mini Profiler
The built-in Mini Profiler is available in ServiceStack's .NET Framework features package:
<PackageReference Include="ServiceStack.NetFramework" Version="10.*" />
Just like the Normal Mvc Mini Profiler you can enable it by registering the MiniProfilerFeature Plugin:
Plugins.Add(new MiniProfilerFeature());
Then starting it in your Global.asax, here's how to enable it for local requests:
protected void Application_BeginRequest(object src, EventArgs e)
{
    if (Request.IsLocal)
        Profiler.Start();
}

protected void Application_EndRequest(object src, EventArgs e)
{
    Profiler.Stop();
}
Now if you also have ServiceStack Razor views you can enable the profiler by putting this into your _Layout.cshtml page:
@ServiceStack.MiniProfiler.Profiler.RenderIncludes().AsRaw()
That's it! Now every time you view a web service or a razor page in your browser (locally) you'll see a profiler view of your service broken down in different stages:
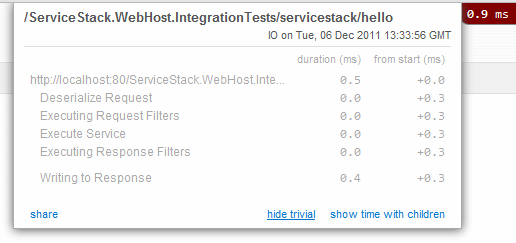
By default you get to see how long it took ServiceStack to de-serialize your request, run any Request / Response Filters and more importantly how long it took to Execute your service.
SQL Profiling
The profiler includes special support for SQL Profiling that can easily be enabled for OrmLite and Dapper by getting it to use a Profiled Connection using a ConnectionFilter:
Plugins.Add(new MiniProfilerFeature()); // Register before using ProfiledDbConnection

this.Container.Register<IDbConnectionFactory>(c =>
    new OrmLiteConnectionFactory(
        "~/App_Data/db.sqlite".MapHostAbsolutePath(), SqliteDialect.Provider) {
            ConnectionFilter = x => new ProfiledDbConnection(x, Profiler.Current)
    });
Refer to the Main MVC MiniProfiler home page for instructions on how to configure profiling for Linq2Sql and EntityFramework.
It's also trivial to add custom steps enabling even finer-grained profiling for your services. Here's a simple web service DB example returning a list of Movies using both a simple DB query and a dreaded N+1 query.
public class MiniProfiler
{
    public string Type { get; set; }
}

public class MiniProfilerService : Service
{
    public object Any(MiniProfiler request)
    {
        var profiler = Profiler.Current;

        using (profiler.Step("MiniProfiler Service"))
        {
            if (request.Type == "n1")
            {
                using (profiler.Step("N + 1 query"))
                {
                    var results = new List<Movie>();
                    foreach (var movie in Db.Select<Movie>())
                    {
                        results.Add(Db.QueryById<Movie>(movie.Id));
                    }
                    return results;
                }
            }

            using (profiler.Step("Simple Select all"))
            {
                return Db.Select<Movie>();
            }
        }
    }
}
View executed SQL
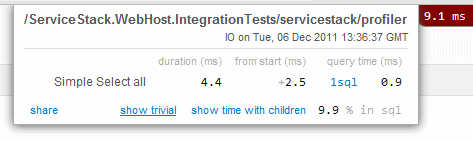
Calling the above service normally provides the following Profiler output:
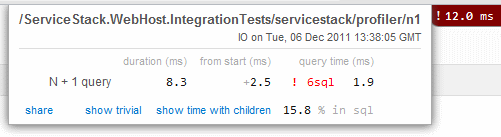
Whilst calling the service with the n1 param yields the following warning:
In both cases you see the actual SQL statements performed by clicking the SQL link. The N+1 query provides shows the following:
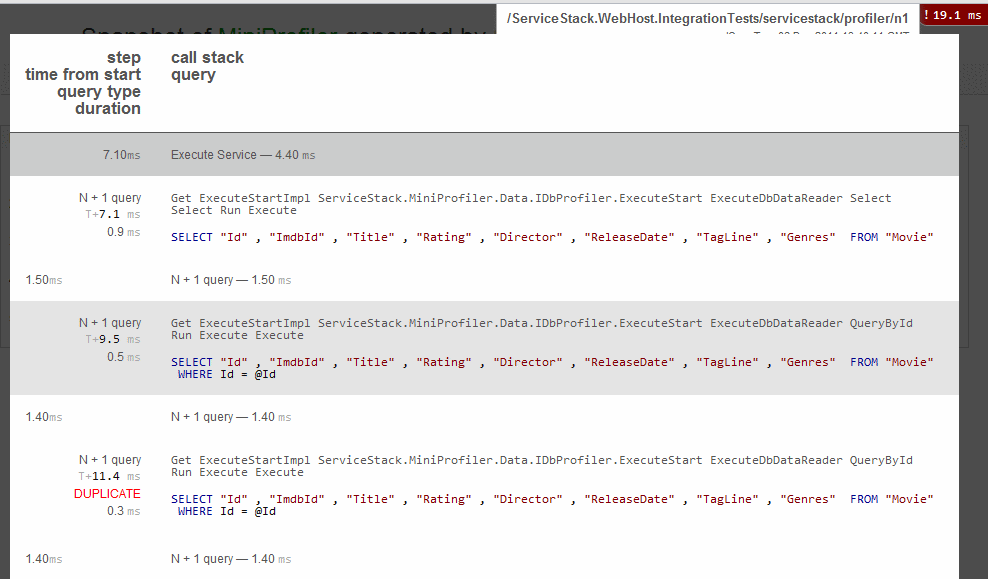
Notice the special attention the MVC MiniProfiler team put into identifying Duplicate queries - Thanks Guys!
Community Resources
- MiniProfiler for AJAX calls with ServiceStack.Net by Jeff Harris