SourceLink Enabled Packages
To maximize the debuggability of ServiceStack packages all ServiceStack projects utilize MSBuild generated NuGet packages where all packages are embed pdb symbols and are configured with support for SourceLink to improve the debugging experience of ServiceStack Apps as source files can be downloaded on-the-fly from GitHub as you debug.
Scott Hanselman has written a nice post on Source Link and how it can be enabled inside VS.NET by turning on Enable source link support:
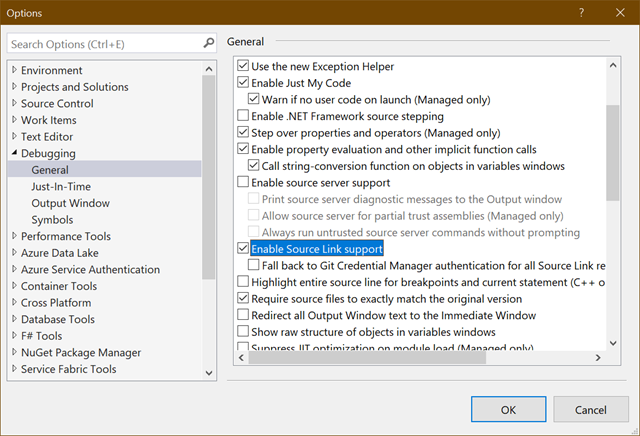
When enabled it should let you debug into the ServiceStack framework implementation, downloading the correct source files version from GitHub as and when needed.
All ServiceStack GitHub projects use CI NuGet feed
In addition to using MSBuild generated packages all projects also utilize CI NuGet package feeds for external dependencies instead of copying
.dll's in /lib folders. As a consequence you'll no longer have to build external ServiceStack GitHub projects or use GitHub published releases,
as now the master repo of all GitHub projects can be built from a clean checkout at anytime.
The pre-release packages are still published using the same version number so if you get a build error from having a cached stale package you'll need to clear your local packages cache to download the latest build packages from the CI NuGet packages feed.
Linking to Source projects
In order to get the best source-based development experience using the latest version of ServiceStack in your Projects, clone the ServiceStack Repos you want to use:
- ServiceStack/ServiceStack
- ServiceStack/ServiceStack.Text
- ServiceStack/ServiceStack.Redis
- ServiceStack/ServiceStack.OrmLite
- ServiceStack/ServiceStack.Aws
- ServiceStack/ServiceStack.Azure
Then reference the *.Source.csproj of each project you want to reference in your solution.
This approach is used in our Test.csproj allowing us to debug directly into ServiceStack library source code just like any other project reference in our solution.
Alternatives Debugging Solutions
GitLink is another solution for debugging source code in NuGet packages.
Otherwise the most reliable solution for debugging ServiceStack source code is to download the source code for the release on Github you want to debug, build the VS.NET Solution locally using Debug configuration then change your ServiceStack references to use your local .dll.
Configuration
DebugMode
ServiceStack allows additional debug information when in DebugMode, which is automatically set by default in Debug builds or explicitly with:
SetConfig(new HostConfig { DebugMode = true });
In addition, users with the Admin role or Requests with an AuthSecret can also view Debug Info in production.
StrictMode
You can configure Strict Mode in ServiceStack to enforce stricter behavior and have it throw Exceptions when it sees certain failure conditions. To enable Strict Mode across all libraries use:
Env.StrictMode = true;
Otherwise to just enable StrictMode for ServiceStack:
SetConfig(new HostConfig {
    StrictMode = true
})
When enabled ServiceStack will perform runtime checks to catch invalid state, currently:
- Checks if Services return Value Types
- Checks if UserSession has circular dependencies
- Fails fast for exceptions on Startup
Admin Role
Users in the Admin role have super-user access giving them access to any services or plugins protected
with Roles and Permissions.
AuthSecret
You can use Config.AdminAuthSecret to specify a special string to give you admin access without having
to login by adding ?authsecret=xxx to the query string, e.g:
SetConfig(new HostConfig { AdminAuthSecret = "secretz" });
By-pass protected services using query string:
/my-service?authsecret=secretz
AuthSecret HttpHeader
In addition to authsecret QueryString, FormData or Cookie, it can also be sent with any request with the authsecret HTTP Header, e.g:
let client = new JsonServiceClient(BaseUrl).apply(c => {
    c.basePath = '/api'
    c.headers.set('authsecret', authsecret)
})
Or it can be sent in the authsecret Cookie or X-Param-Override-authsecret HTTP Header.
Debug Links
To provide better visibility to the hidden functionality in ServiceStack we've added Debug Info links
section to the /metadata page which add links to any Plugins with Web UI's, e.g:

The Debug Links section is only available in DebugMode.
You can add links to your own Plugins in the metadata pages with:
appHost.GetPlugin<MetadataFeature>()
    .AddPluginLink("swagger-ui/", "Swagger UI");

appHost.GetPlugin<MetadataFeature>()
    .AddDebugLink("?debug=requestinfo", "Request Info");
AddPluginLink adds links under the Plugin Links section and should be used if your plugin is publicly
visible, otherwise use AddDebugLink for plugins only available during debugging or development.
Startup Errors
When plugins are registered their Exceptions are swallowed and captured in AppHost.StartupErrors so an
individual Rogue plugin won't prevent your ServiceStack AppHost from starting. But when a plugin doesn't
work properly it can be hard to determine the cause was due to an Exception occuring at Startup.
Alternatively enable StrictMode to have StartUp Exceptions thrown on StartUp.
Debug Inspector
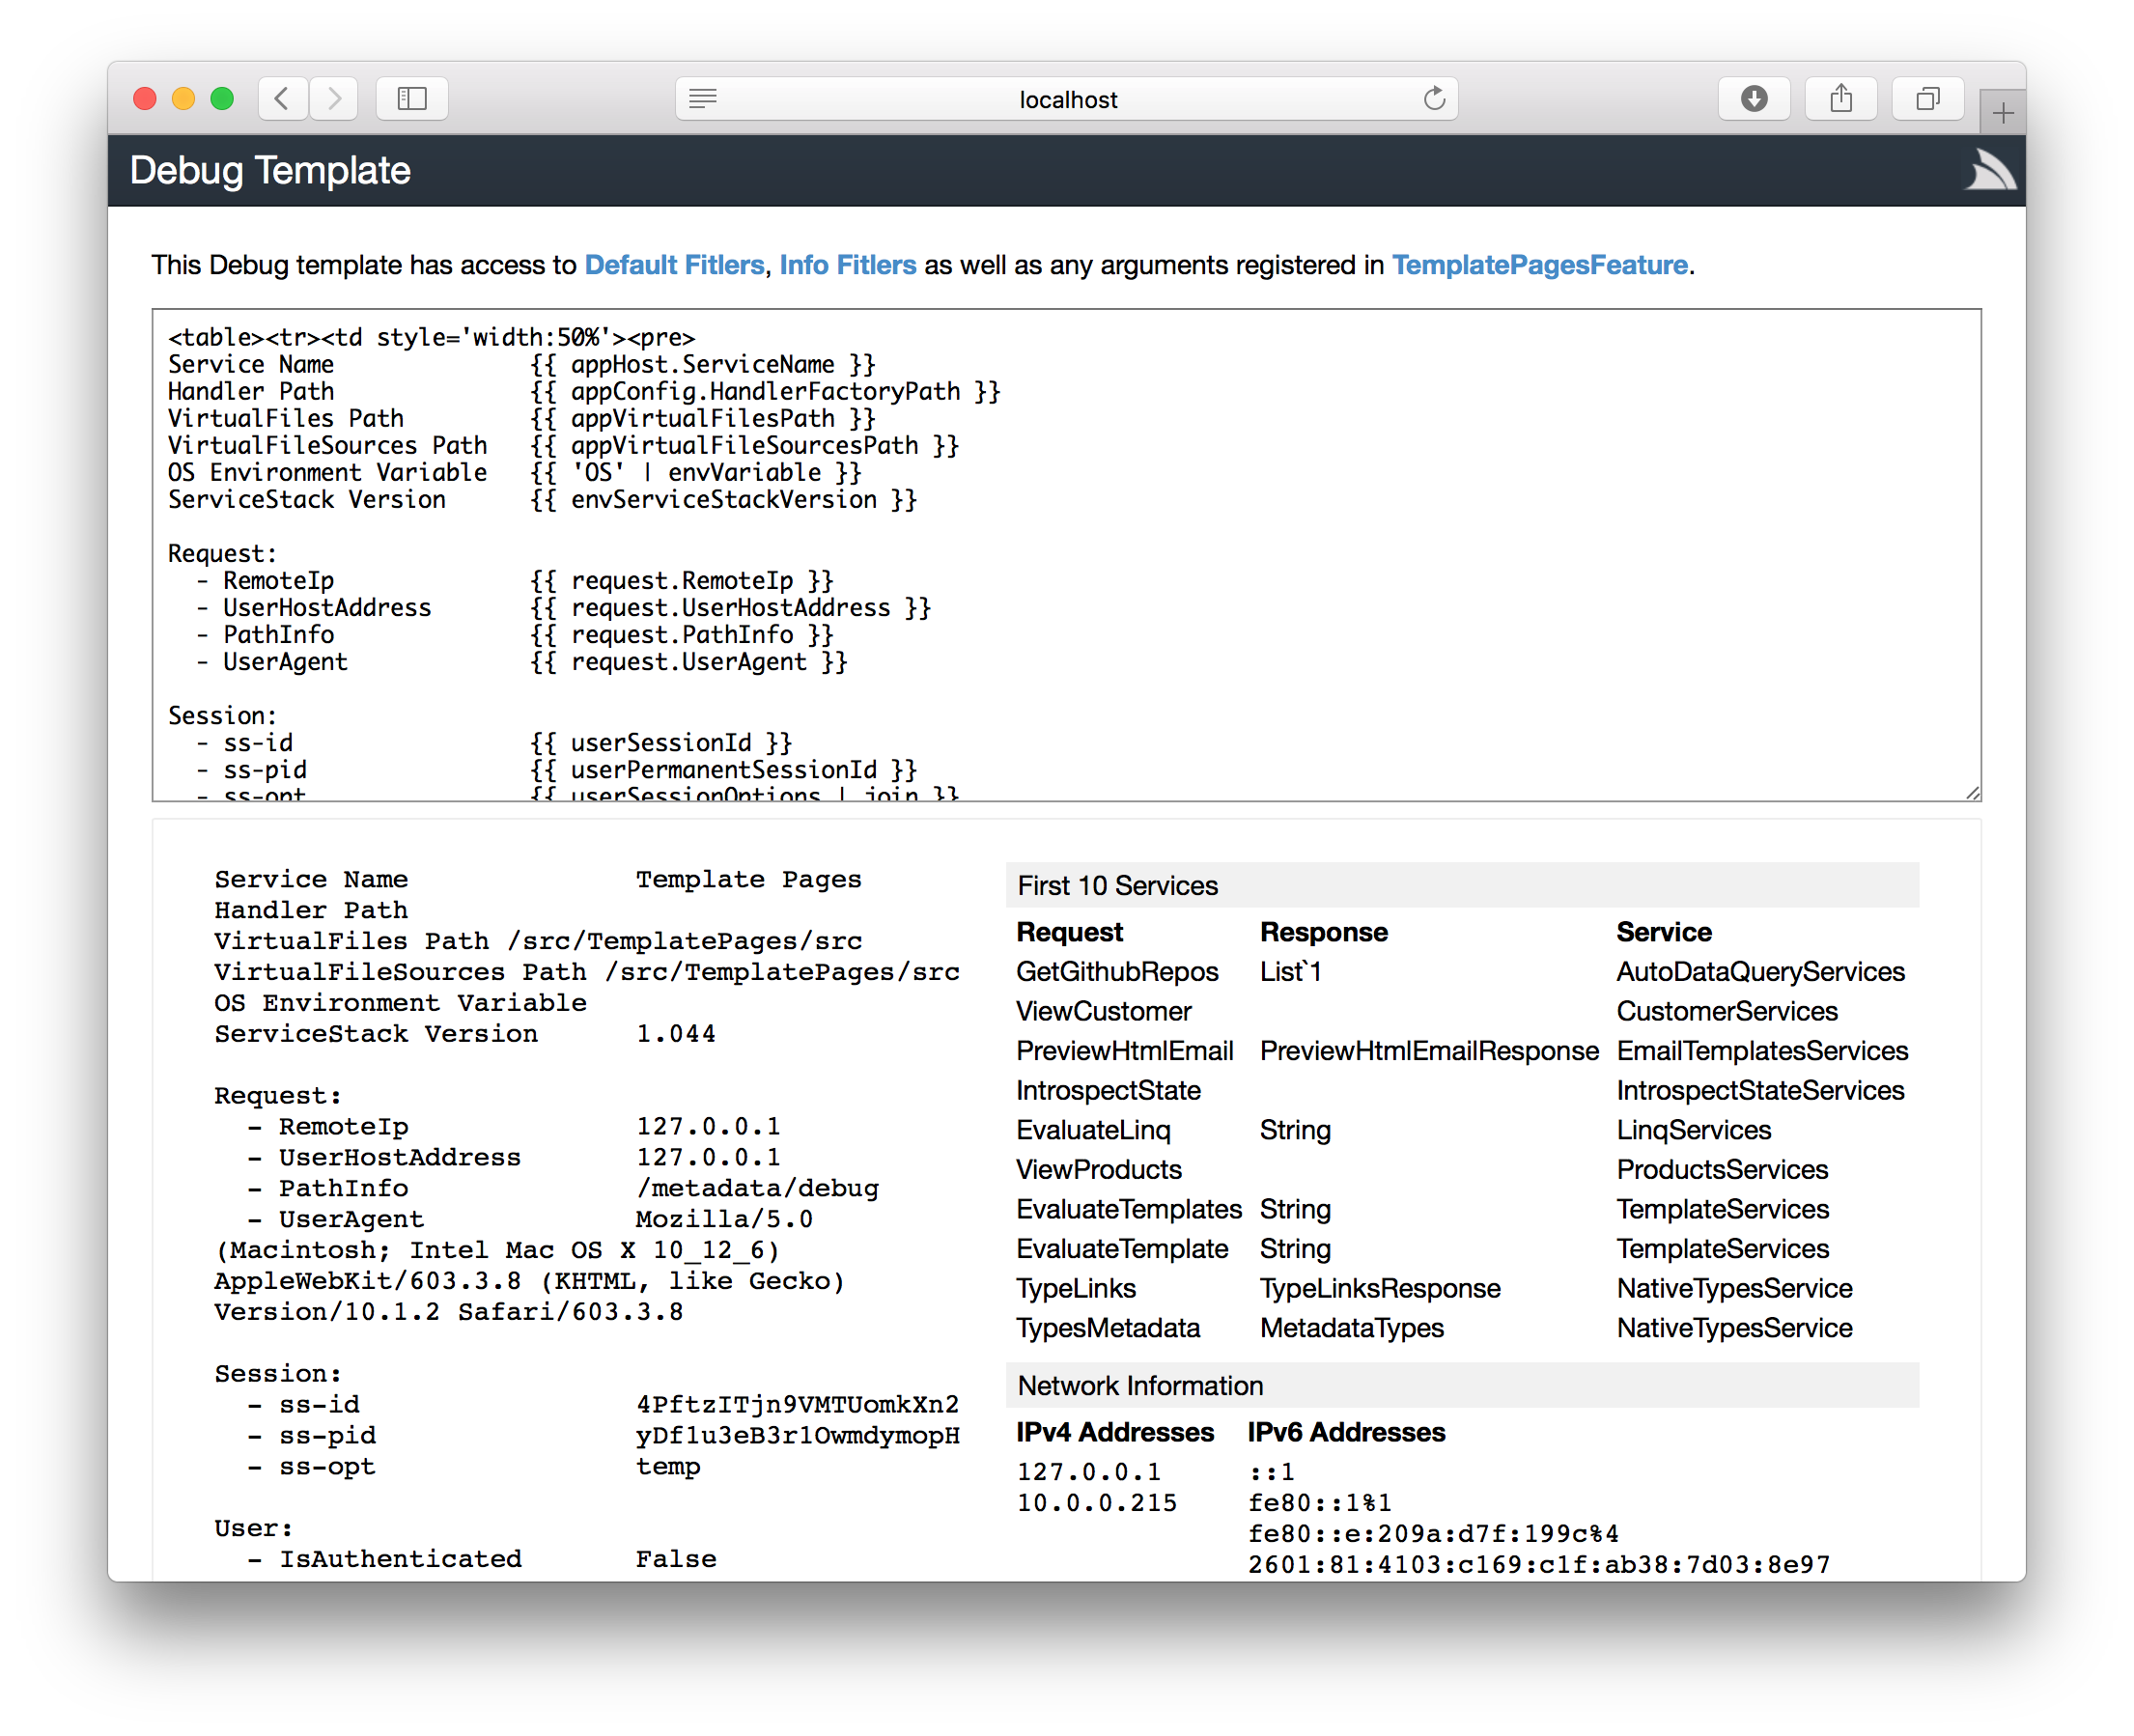
All ServiceStack Apps have access to rich introspection and queryability for inspecting remote ServiceStack instances with the new Debug Inspector.
The Debug Template is a Service in SharpPagesFeature that's pre-registered in DebugMode. The Service can also be available when not in DebugMode by enabling it with:
Plugins.Add(new SharpPagesFeature {
    MetadataDebugAdminRole = RoleNames.Admin,        // Only allow Admin users
})
This registers the Service but limits it to Users with the Admin role, alternatively you configure an
Admin Secret:
SetConfig(new HostConfig { AdminAuthSecret = "secret" })
Which will let you access it by appending the authsecret to the querystring: /metadata/debug?authsecret=secret
Alternatively if preferred you can make the Debug Template Service available to:
Plugins.Add(new SharpPagesFeature {
    MetadataDebugAdminRole = RoleNames.AllowAnyUser,  // Allow Authenticated Users
    MetadataDebugAdminRole = RoleNames.AllowAnon,     // Allow anyone
})
Which is the configuration that allows sharpscript.net/metadata/debug to be accessible to anyone.
Lisp TCP Repl Server
A even greater way to get deeper insights into a Live running remote ServiceStack App is to open a Lisp TCP REPL Server into the server to open a "programmable gateway" into any ServiceStack App where you're able to perform live queries, access IOC dependencies, invoke internal Server functions and query the state of a running Server to provide invaluable insight when diagnosing issues on a remote server.
YouTube
Request Info
ServiceStack's Request Info feature is useful for debugging requests. Just add ?debug=requestinfo
in your /pathinfo and ServiceStack will return a dump of all the HTTP Request parameters to help with
debugging interoperability issues. The RequestInfoFeature is only enabled in DebugMode.
To better highlight the presence of Startup Errors a red warning banner will also appear in /metadata pages when in DebugMode, e.g:
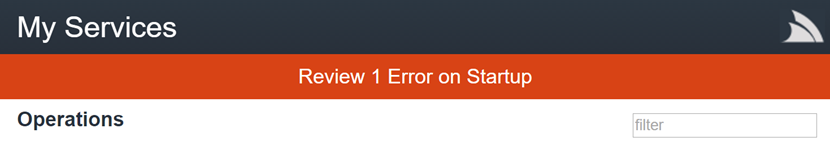
The number of Startup Errors is also added to the X-Startup-Errors: n Global HTTP Header so you'll be
able to notice it when debugging HTTP Traffic.
If you prefer that any Plugin Exception is immediately visible you can register this callback in your
AppHost to throw a YSOD with your first Startup Error:
AfterInitCallbacks.Add(host => {
    var appHost = (ServiceStackHost)host;
    if (appHost.StartUpErrors.Count > 0)
        throw new Exception(appHost.StartUpErrors[0].Message);
});
Plugins
There are a number of plugins that can help with debugging:
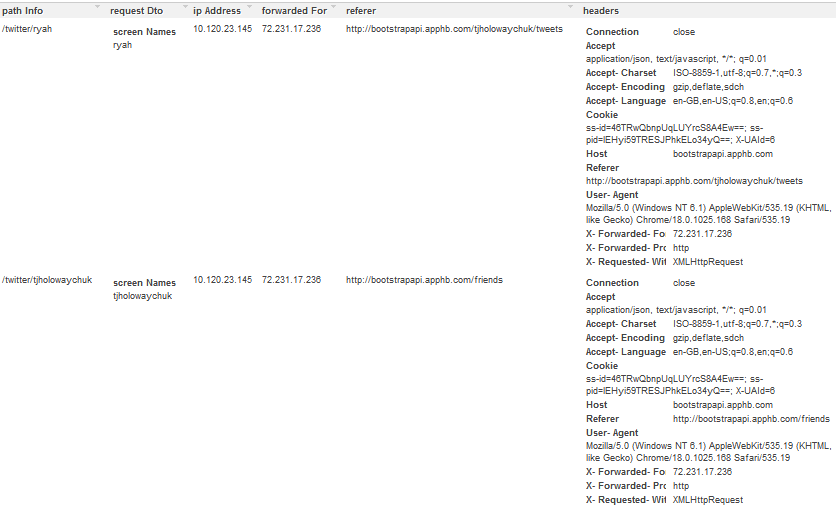
Request Logger
Add an In-Memory IRequestLogger and service with the default route at /requestlogs which maintains a
live log of the most recent requests (and their responses). Supports multiple config options incl.
Rolling-size capacity, error and session tracking, hidden request bodies for sensitive services, etc.
Plugins.Add(new RequestLogsFeature());
The IRequestLogger is a great way to introspect and analyze your service requests in real-time, e.g:
It supports multiple queryString filters and switches so you filter out related requests for better analysis and debuggability:
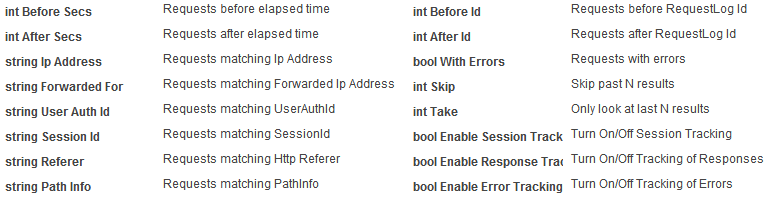
The RequestLogsService is just a simple C# service under-the-hood but is a good example of how a little bit of code can provide a lot of value in ServiceStack's by leveraging its generic, built-in features.